Citibank 2010 Annual Report Download - page 57
Download and view the complete annual report
Please find page 57 of the 2010 Citibank annual report below. You can navigate through the pages in the report by either clicking on the pages listed below, or by using the keyword search tool below to find specific information within the annual report.-
 1
1 -
2
-
3
-
4
-
5
-
6
-
7
-
8
-
9
-
10
-
11
-
12
-
13
-
14
-
15
-
16
-
17
-
18
-
19
-
20
-
21
-
22
-
23
-
24
-
25
-
26
-
27
-
28
-
29
-
30
-
31
-
32
-
33
-
34
-
35
-
36
-
37
-
38
-
39
-
40
-
41
-
42
-
43
-
44
-
45
-
46
-
 47
47 -
 48
48 -
 49
49 -
 50
50 -
 51
51 -
 52
52 -
 53
53 -
 54
54 -
 55
55 -
 56
56 -
 57
57 -
 58
58 -
 59
59 -
 60
60 -
 61
61 -
 62
62 -
 63
63 -
 64
64 -
 65
65 -
 66
66 -
 67
67 -
68
-
69
-
70
-
71
-
72
-
73
-
74
-
75
-
76
-
77
-
78
-
79
-
80
-
81
-
82
-
83
-
84
-
85
-
86
-
87
-
88
-
89
-
90
-
91
-
92
-
93
-
94
-
95
-
96
-
97
-
98
-
99
-
100
-
101
-
102
-
103
-
104
-
105
-
106
-
107
-
108
-
109
-
110
-
111
-
112
-
113
-
114
-
115
-
116
-
117
-
118
-
119
-
120
-
121
-
122
-
123
-
124
-
125
-
126
-
127
-
128
-
129
-
130
-
131
-
132
-
133
-
134
-
135
-
136
-
137
-
138
-
139
-
140
-
141
-
142
-
143
-
144
-
145
-
146
-
147
-
148
-
149
-
150
-
151
-
152
-
153
-
154
-
155
-
156
-
157
-
158
-
159
-
160
-
161
-
162
-
163
-
164
-
165
-
166
-
167
-
168
-
169
-
170
-
171
-
172
-
173
-
174
-
175
-
176
-
177
-
178
-
179
-
180
-
181
-
182
-
183
-
184
-
185
-
186
-
187
-
188
-
189
-
190
-
191
-
192
-
193
-
194
-
195
-
196
-
197
-
198
-
199
-
200
-
201
-
202
-
203
-
204
-
205
-
206
-
207
-
208
-
209
-
210
-
211
-
212
-
213
-
214
-
215
-
216
-
217
-
218
-
219
-
220
-
221
-
222
-
223
-
224
-
225
-
226
-
227
-
228
-
229
-
230
-
231
-
232
-
233
-
234
-
235
-
236
-
237
-
238
-
239
-
240
-
241
-
242
-
243
-
244
-
245
-
246
-
247
-
248
-
249
-
250
-
251
-
252
-
253
-
254
-
255
-
256
-
257
-
258
-
259
-
260
-
261
-
262
-
263
-
264
-
265
-
266
-
267
-
268
-
269
-
270
-
271
-
272
-
273
-
274
-
275
-
276
-
277
-
278
-
279
-
280
-
281
-
282
-
283
-
284
-
285
-
286
-
287
-
288
-
289
-
290
-
291
-
292
-
293
-
294
-
295
-
296
-
297
-
298
-
299
-
300
-
301
-
302
-
303
-
304
-
305
-
306
-
307
-
308
-
309
-
310
-
311
-
312
 |
 |
55
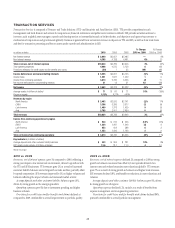
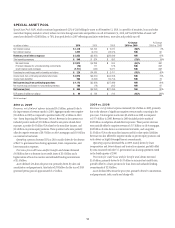
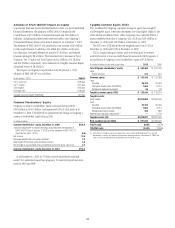
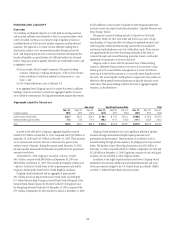
During 2010, average Consumer loans (net of unearned income) of
$495 billion yielded an average rate of 9.4%, compared to $456 billion and
7.8%, respectively, in the prior year. Average Corporate loans of $189 billion
yielded an average rate of 4.5% during 2010, compared to $190 billion and
6.3%, respectively, in the prior year.
For further information on Citi’s loan portfolios, see generally “Managing
Global Risk—Credit Risk” and Notes 1 and 16 to the Consolidated
Financial Statements.
Trading Account Assets and Liabilities
Trading account assets includes debt and marketable equity securities,
derivatives in a receivable position, residual interests in securitizations and
physical commodities inventory. In addition, certain assets that Citigroup has
elected to carry at fair value, such as certain loans and purchase guarantees,
are also included in Trading account assets. Trading account liabilities
includes securities sold, not yet purchased (short positions), and derivatives
in a net payable position, as well as certain liabilities that Citigroup has
elected to carry at fair value.
During 2010, Trading account assets decreased by $26 billion, or 8%,
primarily due to decreases in debt securities ($17 billion, or 53%), derivative
assets ($9 billion, or 15%), equity securities ($8 billion, or 17%) and U.S.
Treasury and federal agency securities ($7 billion, or 24%), partially offset
by a $16 billion, or 21%, increase in foreign government securities. Average
Trading account assets were $337 billion in 2010, compared to $350 billion
in 2009.
During 2010, Trading account liabilities decreased by $9 billion, or
7%, primarily due to a $4 billion, or 7%, decrease in derivative liabilities,
and a $4 billion, or 6%, decrease in securities short positions (primarily
U.S. Treasury securities). In 2010, average Trading account liabilities were
$128 billion, compared to $139 billion in 2009.
For further information on Citi’s Trading account assets and Trading
account liabilities, see Note 14 to the Consolidated Financial Statements.
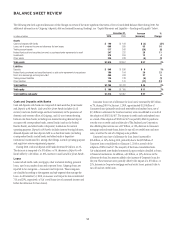
Federal Funds Sold (Purchased) and Securities
Borrowed (Loaned) or Purchased (Sold) Under
Agreements to Resell (Repurchase)
Securities sold under agreements to repurchase (repos) and securities
lending transactions generally do not constitute a sale of the underlying
securities for accounting purposes and, as such, are treated as collateralized
financing transactions. Similarly, securities purchased under agreements to
resell (reverse repos) and securities borrowing transactions generally do not
constitute a purchase of the underlying securities for accounting purposes
and so are treated as collateralized lending transactions. Reverse repos and
securities borrowing transactions increased by $25 billion, or 11%, during
2010. For further information on repos and securities lending transactions,
see “Capital Resources and Liquidity—Funding and Liquidity” below.
Federal funds sold and federal funds purchased consist of unsecured
advances of excess balances in reserve accounts held at the Federal Reserve
Banks to and from third parties. During 2009 and 2010, Citi’s federal funds
sold and federal funds purchased were not significant.
For further information regarding these balance sheet categories, see
Notes 1 and 12 to the Consolidated Financial Statements.
Investments
Investments consists of debt and equity securities that are available-for-sale,
debt securities that are held-to-maturity, non-marketable equity securities
that are carried at fair value, and non-marketable equity securities carried at
cost. Debt securities include bonds, notes and redeemable preferred stock, as
well as certain loan-backed securities (such as mortgage-backed securities)
and other structured notes. Marketable and non-marketable equity securities
carried at fair value include common and nonredeemable preferred stock.
Non-marketable equity securities carried at cost primarily include equity
shares issued by the Federal Reserve Bank and the Federal Home Loan Banks
that Citigroup is required to hold.
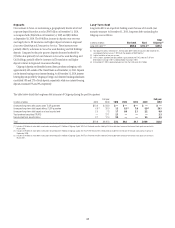
During 2010, investments increased by $12 billion, or 4%, primarily due
to a $34 billion, or 14%, increase in available-for-sale (predominantly U.S.
Treasury and federal agency securities), offset by a $22 billion decrease in
held-to-maturity securities (predominantly asset-backed and mortgage-
backed securities).
For further information regarding Investments, see Notes 1 and 15 to the
Consolidated Financial Statements.
Other Assets
Other assets consists of Brokerage receivables, Goodwill, Intangibles and
Mortgage servicing rights in addition to Other assets as presented on the
Consolidated Balance Sheet (including, among other items, loans held-
for-sale, deferred tax assets, equity-method investments, interest and fees
receivable, premises and equipment, end-user derivatives in a net receivable
position, repossessed assets, and other receivables). During 2010, Other
assets decreased $4 billion, or 2%, primarily due to a $2 billion decrease in
brokerage receivables, a $2 billion decrease in mortgage servicing rights
and a $1 billion decrease in intangible assets, partially offset by a $1 billion
increase in goodwill and a $1 billion increase in other assets.