Citibank 2010 Annual Report Download - page 88
Download and view the complete annual report
Please find page 88 of the 2010 Citibank annual report below. You can navigate through the pages in the report by either clicking on the pages listed below, or by using the keyword search tool below to find specific information within the annual report.-
 1
1 -
2
-
3
-
4
-
5
-
6
-
7
-
8
-
9
-
10
-
11
-
12
-
13
-
14
-
15
-
16
-
17
-
18
-
19
-
20
-
21
-
22
-
23
-
24
-
25
-
26
-
27
-
28
-
29
-
30
-
31
-
32
-
33
-
34
-
35
-
36
-
37
-
38
-
39
-
40
-
41
-
42
-
43
-
44
-
45
-
46
-
47
-
48
-
49
-
50
-
51
-
52
-
53
-
54
-
55
-
56
-
57
-
58
-
59
-
60
-
61
-
62
-
63
-
64
-
65
-
66
-
67
-
68
-
69
-
70
-
71
-
72
-
73
-
74
-
75
-
76
-
77
-
 78
78 -
 79
79 -
 80
80 -
 81
81 -
 82
82 -
 83
83 -
 84
84 -
 85
85 -
 86
86 -
 87
87 -
 88
88 -
 89
89 -
 90
90 -
 91
91 -
 92
92 -
 93
93 -
 94
94 -
 95
95 -
 96
96 -
 97
97 -
 98
98 -
99
-
100
-
101
-
102
-
103
-
104
-
105
-
106
-
107
-
108
-
109
-
110
-
111
-
112
-
113
-
114
-
115
-
116
-
117
-
118
-
119
-
120
-
121
-
122
-
123
-
124
-
125
-
126
-
127
-
128
-
129
-
130
-
131
-
132
-
133
-
134
-
135
-
136
-
137
-
138
-
139
-
140
-
141
-
142
-
143
-
144
-
145
-
146
-
147
-
148
-
149
-
150
-
151
-
152
-
153
-
154
-
155
-
156
-
157
-
158
-
159
-
160
-
161
-
162
-
163
-
164
-
165
-
166
-
167
-
168
-
169
-
170
-
171
-
172
-
173
-
174
-
175
-
176
-
177
-
178
-
179
-
180
-
181
-
182
-
183
-
184
-
185
-
186
-
187
-
188
-
189
-
190
-
191
-
192
-
193
-
194
-
195
-
196
-
197
-
198
-
199
-
200
-
201
-
202
-
203
-
204
-
205
-
206
-
207
-
208
-
209
-
210
-
211
-
212
-
213
-
214
-
215
-
216
-
217
-
218
-
219
-
220
-
221
-
222
-
223
-
224
-
225
-
226
-
227
-
228
-
229
-
230
-
231
-
232
-
233
-
234
-
235
-
236
-
237
-
238
-
239
-
240
-
241
-
242
-
243
-
244
-
245
-
246
-
247
-
248
-
249
-
250
-
251
-
252
-
253
-
254
-
255
-
256
-
257
-
258
-
259
-
260
-
261
-
262
-
263
-
264
-
265
-
266
-
267
-
268
-
269
-
270
-
271
-
272
-
273
-
274
-
275
-
276
-
277
-
278
-
279
-
280
-
281
-
282
-
283
-
284
-
285
-
286
-
287
-
288
-
289
-
290
-
291
-
292
-
293
-
294
-
295
-
296
-
297
-
298
-
299
-
300
-
301
-
302
-
303
-
304
-
305
-
306
-
307
-
308
-
309
-
310
-
311
-
312
 |
 |

86
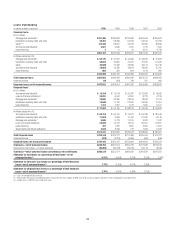
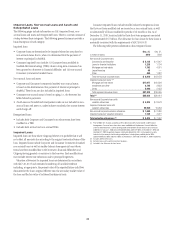
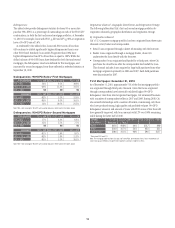
Details of Credit Loss Experience
In millions of dollars at year end 2010 2009 2008 2007 2006
Allowance for loan losses at beginning of year $36,033 $29,616 $16,117 $ 8,940 $ 9,782
Provision for loan losses
Consumer $25,119 $32,418 $27,942 $15,660 $ 6,129
Corporate 75 6,342 5,732 1,172 191
$25,194 $38,760 $33,674 $16,832 $ 6,320
Gross credit losses
Consumer
In U.S. offices $24,183 $17,637 $11,624 $ 5,765 $ 4,413
In offices outside the U.S. 6,892 8,834 7,172 5,165 3,932
Corporate
Mortgage and real estate
In U.S. offices 953 592 56 1 —
In offices outside the U.S. 286 151 37 3 1
Governments and official institutions outside the U.S. —— 3 — —
Loans to financial institutions
In U.S. offices 275 274 — — —
In offices outside the U.S. 111 448 463 69 6
Commercial and industrial
In U.S. offices 1,222 3,299 627 635 85
In offices outside the U.S. 569 1,549 778 226 203
$34,491 $32,784 $20,760 $11,864 $ 8,640
Credit recoveries
Consumer
In U.S. offices $ 1,323 $ 576 $ 585 $ 695 $ 646
In offices outside the U.S. 1,315 1,089 1,050 966 897
Corporate
Mortgage and real estate
In U.S. offices 130 3 — 3 5
In offices outside the U.S. 26 1 1 — 18
Governments and official institutions outside the U.S. —— — 4 7
Loans to financial institutions
In U.S. offices —— — — —
In offices outside the U.S. 132 11 2 1 4
Commercial and industrial
In U.S. offices 591 276 6 49 20
In offices outside the U.S. 115 87 105 220 182
$ 3,632 $ 2,043 $ 1,749 $ 1,938 $ 1,779
Net credit losses
In U.S. offices $24,589 $20,947 $11,716 $ 5,654 $ 3,827
In offices outside the U.S. 6,270 9,794 7,295 4,272 3,034
Total $30,859 $30,741 $19,011 $ 9,926 $ 6,861
Other—net (1) $10,287 $ (1,602) $ (1,164) $ 271 $ (301)
Allowance for loan losses at end of year (2) $40,655 $36,033 $29,616 $16,117 $ 8,940
Allowance for unfunded lending commitments (3) $ 1,066 $ 1,157 $ 887 $ 1,250 $ 1,100
Total allowance for loans, leases and unfunded lending commitments $41,721 $37,190 $30,503 $17,367 $10,040
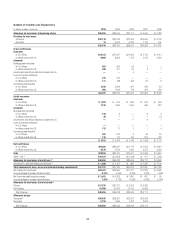
Net Consumer credit losses $28,437 $24,806 $17,161 $ 9,269 $ 6,802
As a percentage of average Consumer loans 5.74% 5.44% 3.34% 1.87% 1.52%
Net Corporate credit losses (recoveries) $ 2,422 $ 5,935 $ 1,850 $ 657 $ 59
As a percentage of average Corporate loans 1.28% 3.12% 0.84% 0.30% 0.05%
Allowance for loan losses at end of period (4)
Citicorp $17,075 $10,731 $ 8,202 $ 5,262
Citi Holdings 23,580 25,302 21,414 10,855
Total Citigroup $40,655 $36,033 $29,616 $16,117
Allowance by type
Consumer (5) $35,445 $28,397 $22,204 $12,493
Corporate 5,210 7,636 7,412 3,624
Total Citigroup $40,655 $36,033 $29,616 $16,117