Citibank 2010 Annual Report Download - page 217
Download and view the complete annual report
Please find page 217 of the 2010 Citibank annual report below. You can navigate through the pages in the report by either clicking on the pages listed below, or by using the keyword search tool below to find specific information within the annual report.-
 1
1 -
2
-
3
-
4
-
5
-
6
-
7
-
8
-
9
-
10
-
11
-
12
-
13
-
14
-
15
-
16
-
17
-
18
-
19
-
20
-
21
-
22
-
23
-
24
-
25
-
26
-
27
-
28
-
29
-
30
-
31
-
32
-
33
-
34
-
35
-
36
-
37
-
38
-
39
-
40
-
41
-
42
-
43
-
44
-
45
-
46
-
47
-
48
-
49
-
50
-
51
-
52
-
53
-
54
-
55
-
56
-
57
-
58
-
59
-
60
-
61
-
62
-
63
-
64
-
65
-
66
-
67
-
68
-
69
-
70
-
71
-
72
-
73
-
74
-
75
-
76
-
77
-
78
-
79
-
80
-
81
-
82
-
83
-
84
-
85
-
86
-
87
-
88
-
89
-
90
-
91
-
92
-
93
-
94
-
95
-
96
-
97
-
98
-
99
-
100
-
101
-
102
-
103
-
104
-
105
-
106
-
107
-
108
-
109
-
110
-
111
-
112
-
113
-
114
-
115
-
116
-
117
-
118
-
119
-
120
-
121
-
122
-
123
-
124
-
125
-
126
-
127
-
128
-
129
-
130
-
131
-
132
-
133
-
134
-
135
-
136
-
137
-
138
-
139
-
140
-
141
-
142
-
143
-
144
-
145
-
146
-
147
-
148
-
149
-
150
-
151
-
152
-
153
-
154
-
155
-
156
-
157
-
158
-
159
-
160
-
161
-
162
-
163
-
164
-
165
-
166
-
167
-
168
-
169
-
170
-
171
-
172
-
173
-
174
-
175
-
176
-
177
-
178
-
179
-
180
-
181
-
182
-
183
-
184
-
185
-
186
-
187
-
188
-
189
-
190
-
191
-
192
-
193
-
194
-
195
-
196
-
197
-
198
-
199
-
200
-
201
-
202
-
203
-
204
-
205
-
206
-
 207
207 -
 208
208 -
 209
209 -
 210
210 -
 211
211 -
 212
212 -
 213
213 -
 214
214 -
 215
215 -
 216
216 -
 217
217 -
 218
218 -
 219
219 -
 220
220 -
 221
221 -
 222
222 -
 223
223 -
 224
224 -
 225
225 -
 226
226 -
 227
227 -
228
-
229
-
230
-
231
-
232
-
233
-
234
-
235
-
236
-
237
-
238
-
239
-
240
-
241
-
242
-
243
-
244
-
245
-
246
-
247
-
248
-
249
-
250
-
251
-
252
-
253
-
254
-
255
-
256
-
257
-
258
-
259
-
260
-
261
-
262
-
263
-
264
-
265
-
266
-
267
-
268
-
269
-
270
-
271
-
272
-
273
-
274
-
275
-
276
-
277
-
278
-
279
-
280
-
281
-
282
-
283
-
284
-
285
-
286
-
287
-
288
-
289
-
290
-
291
-
292
-
293
-
294
-
295
-
296
-
297
-
298
-
299
-
300
-
301
-
302
-
303
-
304
-
305
-
306
-
307
-
308
-
309
-
310
-
311
-
312
 |
 |

215
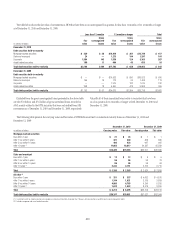
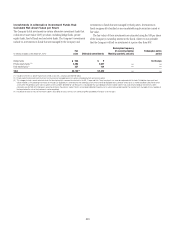
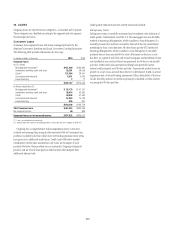
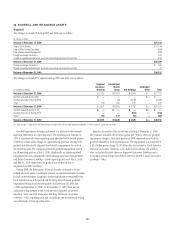
16. LOANS
Citigroup loans are reported in two categories—Consumer and Corporate.
These categories are classified according to the segment and sub-segment
that manages the loans.
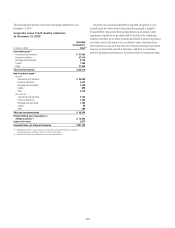
Consumer Loans
Consumer loans represent loans and leases managed primarily by the
Regional Consumer Banking and Local Consumer Lending businesses.
The following table provides information by loan type:
In millions of dollars at year end 2010 2009
Consumer loans
In U.S. offices
Mortgage and real estate (1) $151,469 $183,842
Installment, revolving credit, and other 28,291 58,099
Cards (2) 122,384 28,951
Commercial and industrial 5,021 5,640
Lease financing 211
$307,167 $276,543
In offices outside the U.S.
Mortgage and real estate (1) $ 52,175 $ 47,297
Installment, revolving credit, and other 38,024 42,805
Cards 40,948 41,493
Commercial and industrial 18,584 14,780
Lease financing 665 331
$150,396 $146,706
Total Consumer loans $457,563 $423,249
Net unearned income 69 808
Consumer loans, net of unearned income $457,632 $424,057
(1) Loans secured primarily by real estate.
(2) 2010 includes the impact of consolidating entities in connection with Citi’s adoption of SFAS 167.
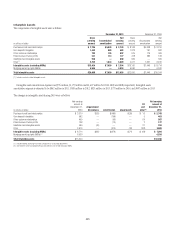
Citigroup has a comprehensive risk management process to monitor,
evaluate and manage the principal risks associated with its Consumer loan
portfolio. Included in the loan table above are lending products whose terms
may give rise to additional credit issues. Credit cards with below-market
introductory interest rates and interest-only loans are examples of such
products. However, these products are not material to Citigroup’s financial
position and are closely managed via credit controls that mitigate their
additional inherent risk.
Credit quality indicators that are actively monitored include:
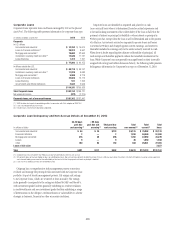
Delinquency Status
Delinquency status is carefully monitored and considered a key indicator of
credit quality. Substantially all of the U.S. first mortgage loans use the MBA
method of reporting delinquencies, which considers a loan delinquent if a
monthly payment has not been received by the end of the day immediately
preceding the loan’s next due date. All other loans use the OTS method of
reporting delinquencies, which considers a loan delinquent if a monthly
payment has not been received by the close of business on the loan’s next
due date. As a general rule, first and second mortgages and installment loans
are classified as non-accrual when loan payments are 90 days contractually
past due. Credit cards and unsecured revolving loans generally accrue
interest until payments are 180 days past due. Commercial market loans are
placed on a cash (non-accrual) basis when it is determined, based on actual
experience and a forward-looking assessment of the collectability of the loan
in full, that the payment of interest or principal is doubtful or when interest
or principal is 90 days past due.