Citibank 2010 Annual Report Download - page 60
Download and view the complete annual report
Please find page 60 of the 2010 Citibank annual report below. You can navigate through the pages in the report by either clicking on the pages listed below, or by using the keyword search tool below to find specific information within the annual report.-
 1
1 -
2
-
3
-
4
-
5
-
6
-
7
-
8
-
9
-
10
-
11
-
12
-
13
-
14
-
15
-
16
-
17
-
18
-
19
-
20
-
21
-
22
-
23
-
24
-
25
-
26
-
27
-
28
-
29
-
30
-
31
-
32
-
33
-
34
-
35
-
36
-
37
-
38
-
39
-
40
-
41
-
42
-
43
-
44
-
45
-
46
-
47
-
48
-
49
-
 50
50 -
 51
51 -
 52
52 -
 53
53 -
 54
54 -
 55
55 -
 56
56 -
 57
57 -
 58
58 -
 59
59 -
 60
60 -
 61
61 -
 62
62 -
 63
63 -
 64
64 -
 65
65 -
 66
66 -
 67
67 -
 68
68 -
 69
69 -
 70
70 -
71
-
72
-
73
-
74
-
75
-
76
-
77
-
78
-
79
-
80
-
81
-
82
-
83
-
84
-
85
-
86
-
87
-
88
-
89
-
90
-
91
-
92
-
93
-
94
-
95
-
96
-
97
-
98
-
99
-
100
-
101
-
102
-
103
-
104
-
105
-
106
-
107
-
108
-
109
-
110
-
111
-
112
-
113
-
114
-
115
-
116
-
117
-
118
-
119
-
120
-
121
-
122
-
123
-
124
-
125
-
126
-
127
-
128
-
129
-
130
-
131
-
132
-
133
-
134
-
135
-
136
-
137
-
138
-
139
-
140
-
141
-
142
-
143
-
144
-
145
-
146
-
147
-
148
-
149
-
150
-
151
-
152
-
153
-
154
-
155
-
156
-
157
-
158
-
159
-
160
-
161
-
162
-
163
-
164
-
165
-
166
-
167
-
168
-
169
-
170
-
171
-
172
-
173
-
174
-
175
-
176
-
177
-
178
-
179
-
180
-
181
-
182
-
183
-
184
-
185
-
186
-
187
-
188
-
189
-
190
-
191
-
192
-
193
-
194
-
195
-
196
-
197
-
198
-
199
-
200
-
201
-
202
-
203
-
204
-
205
-
206
-
207
-
208
-
209
-
210
-
211
-
212
-
213
-
214
-
215
-
216
-
217
-
218
-
219
-
220
-
221
-
222
-
223
-
224
-
225
-
226
-
227
-
228
-
229
-
230
-
231
-
232
-
233
-
234
-
235
-
236
-
237
-
238
-
239
-
240
-
241
-
242
-
243
-
244
-
245
-
246
-
247
-
248
-
249
-
250
-
251
-
252
-
253
-
254
-
255
-
256
-
257
-
258
-
259
-
260
-
261
-
262
-
263
-
264
-
265
-
266
-
267
-
268
-
269
-
270
-
271
-
272
-
273
-
274
-
275
-
276
-
277
-
278
-
279
-
280
-
281
-
282
-
283
-
284
-
285
-
286
-
287
-
288
-
289
-
290
-
291
-
292
-
293
-
294
-
295
-
296
-
297
-
298
-
299
-
300
-
301
-
302
-
303
-
304
-
305
-
306
-
307
-
308
-
309
-
310
-
311
-
312
 |
 |
58
CAPITAL RESOURCES AND LIQUIDITY
CAPITAL RESOURCES
Overview
Citi generates capital through earnings from its operating businesses.
However, Citi may augment, and during the financial crisis did augment,
its capital through issuances of common stock, convertible preferred stock,
preferred stock and equity issued through awards under employee benefit plans.
Citi also augmented its regulatory capital through the issuance of subordinated
debt underlying trust preferred securities, although the treatment of such
instruments as regulatory capital will be phased out under Basel III and the
Financial Reform Act (see “Regulatory Capital Standards Developments”
and “Risk Factors” below). Further, the impact of future events on Citi’s
business results, such as corporate and asset dispositions, as well as changes in
regulatory and accounting standards, also affects Citi’s capital levels.
Capital is used primarily to support assets in Citi’s businesses and to
absorb market, credit or operational losses. While capital may be used for
other purposes, such as to pay dividends or repurchase common stock, Citi’s
ability to utilize its capital for these purposes is currently restricted due to,
among other things, its agreements with certain U.S. government entities,
generally for so long as the U.S. government continues to hold any Citi
trust preferred securities acquired in connection with the exchange offers
consummated in 2009. See “Risk Factors” below.
Citigroup’s capital management framework is designed to ensure that
Citigroup and its principal subsidiaries maintain sufficient capital consistent
with Citi’s risk profile and all applicable regulatory standards and guidelines,
as well as external rating agency considerations. Senior management is
responsible for the capital management process mainly through Citigroup’s
Finance and Asset and Liability Committee (FinALCO), with oversight from
the Risk Management and Finance Committee of Citigroup’s Board of
Directors. FinALCO is composed of the senior-most management of Citigroup
for the purpose of engaging management in decision-making and related
discussions on capital and liquidity matters. Among other things, FinALCO’s
responsibilities include: determining the financial structure of Citigroup and
its principal subsidiaries; ensuring that Citigroup and its regulated entities
are adequately capitalized in consultation with its regulators; determining
appropriate asset levels and return hurdles for Citigroup and individual
businesses; reviewing the funding and capital markets plan for Citigroup;
and setting and monitoring corporate and bank liquidity levels, and the
impact of currency translation on non-U.S. capital.
Capital Ratios
Citigroup is subject to the risk-based capital guidelines issued by the Federal
Reserve Board. Historically, capital adequacy has been measured, in part,
based on two risk-based capital ratios, the Tier 1 Capital and Total Capital
(Tier 1 Capital + Tier 2 Capital) ratios. Tier 1 Capital consists of the sum of
“core capital elements,” such as qualifying common stockholders’ equity,
as adjusted, qualifying noncontrolling interests, and qualifying mandatorily
redeemable securities of subsidiary trusts, principally reduced by goodwill,
other disallowed intangible assets, and disallowed deferred tax assets. Total
Capital also includes “supplementary” Tier 2 Capital elements, such as
qualifying subordinated debt and a limited portion of the allowance for credit
losses. Both measures of capital adequacy are stated as a percentage of risk-
weighted assets.
In 2009, the U.S. banking regulators developed a new measure of capital
termed “Tier 1 Common,” which is defined as Tier 1 Capital less non-
common elements, including qualifying perpetual preferred stock, qualifying
noncontrolling interests, and qualifying mandatorily redeemable securities
of subsidiary trusts. For more detail on all of these capital metrics, see
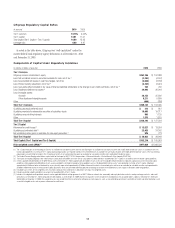
“Components of Capital Under Regulatory Guidelines” below.
Citigroup’s risk-weighted assets are principally derived from application
of the risk-based capital guidelines related to the measurement of credit
risk. Pursuant to these guidelines, on-balance-sheet assets and the credit
equivalent amount of certain off-balance-sheet exposures (such as
financial guarantees, unfunded lending commitments, letters of credit, and
derivatives) are assigned to one of several prescribed risk-weight categories
based upon the perceived credit risk associated with the obligor, or if relevant,
the guarantor, the nature of the collateral, or external credit ratings.
Risk-weighted assets also incorporate a measure for market risk on covered
trading account positions and all foreign exchange and commodity positions
whether or not carried in the trading account. Excluded from risk-weighted
assets are any assets, such as goodwill and deferred tax assets, to the extent
required to be deducted from regulatory capital. See “Components of Capital
Under Regulatory Guidelines” below.
Citigroup is also subject to a Leverage ratio requirement, a non-risk-
based measure of capital adequacy, which is defined as Tier 1 Capital as a
percentage of quarterly adjusted average total assets.
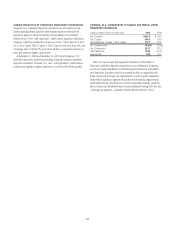
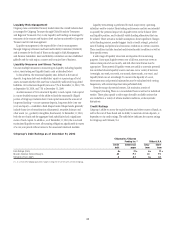
To be “well capitalized” under current federal bank regulatory agency
definitions, a bank holding company must have a Tier 1 Capital ratio of
at least 6%, a Total Capital ratio of at least 10%, and a Leverage ratio of at
least 3%, and not be subject to a Federal Reserve Board directive to maintain
higher capital levels. The following table sets forth Citigroup’s regulatory
capital ratios as of December 31, 2010 and December 31, 2009.