Citibank 2010 Annual Report Download - page 123
Download and view the complete annual report
Please find page 123 of the 2010 Citibank annual report below. You can navigate through the pages in the report by either clicking on the pages listed below, or by using the keyword search tool below to find specific information within the annual report.-
 1
1 -
2
-
3
-
4
-
5
-
6
-
7
-
8
-
9
-
10
-
11
-
12
-
13
-
14
-
15
-
16
-
17
-
18
-
19
-
20
-
21
-
22
-
23
-
24
-
25
-
26
-
27
-
28
-
29
-
30
-
31
-
32
-
33
-
34
-
35
-
36
-
37
-
38
-
39
-
40
-
41
-
42
-
43
-
44
-
45
-
46
-
47
-
48
-
49
-
50
-
51
-
52
-
53
-
54
-
55
-
56
-
57
-
58
-
59
-
60
-
61
-
62
-
63
-
64
-
65
-
66
-
67
-
68
-
69
-
70
-
71
-
72
-
73
-
74
-
75
-
76
-
77
-
78
-
79
-
80
-
81
-
82
-
83
-
84
-
85
-
86
-
87
-
88
-
89
-
90
-
91
-
92
-
93
-
94
-
95
-
96
-
97
-
98
-
99
-
100
-
101
-
102
-
103
-
104
-
105
-
106
-
107
-
108
-
109
-
110
-
111
-
112
-
 113
113 -
 114
114 -
 115
115 -
 116
116 -
 117
117 -
 118
118 -
 119
119 -
 120
120 -
 121
121 -
 122
122 -
 123
123 -
 124
124 -
 125
125 -
 126
126 -
 127
127 -
 128
128 -
 129
129 -
 130
130 -
 131
131 -
 132
132 -
 133
133 -
134
-
135
-
136
-
137
-
138
-
139
-
140
-
141
-
142
-
143
-
144
-
145
-
146
-
147
-
148
-
149
-
150
-
151
-
152
-
153
-
154
-
155
-
156
-
157
-
158
-
159
-
160
-
161
-
162
-
163
-
164
-
165
-
166
-
167
-
168
-
169
-
170
-
171
-
172
-
173
-
174
-
175
-
176
-
177
-
178
-
179
-
180
-
181
-
182
-
183
-
184
-
185
-
186
-
187
-
188
-
189
-
190
-
191
-
192
-
193
-
194
-
195
-
196
-
197
-
198
-
199
-
200
-
201
-
202
-
203
-
204
-
205
-
206
-
207
-
208
-
209
-
210
-
211
-
212
-
213
-
214
-
215
-
216
-
217
-
218
-
219
-
220
-
221
-
222
-
223
-
224
-
225
-
226
-
227
-
228
-
229
-
230
-
231
-
232
-
233
-
234
-
235
-
236
-
237
-
238
-
239
-
240
-
241
-
242
-
243
-
244
-
245
-
246
-
247
-
248
-
249
-
250
-
251
-
252
-
253
-
254
-
255
-
256
-
257
-
258
-
259
-
260
-
261
-
262
-
263
-
264
-
265
-
266
-
267
-
268
-
269
-
270
-
271
-
272
-
273
-
274
-
275
-
276
-
277
-
278
-
279
-
280
-
281
-
282
-
283
-
284
-
285
-
286
-
287
-
288
-
289
-
290
-
291
-
292
-
293
-
294
-
295
-
296
-
297
-
298
-
299
-
300
-
301
-
302
-
303
-
304
-
305
-
306
-
307
-
308
-
309
-
310
-
311
-
312
 |
 |
121
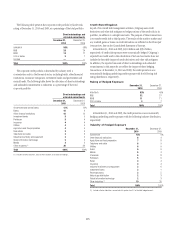
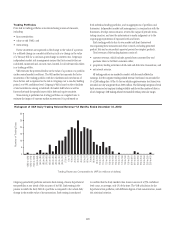
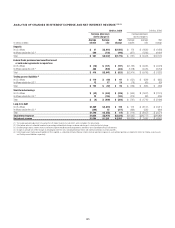
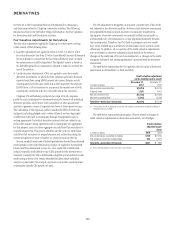
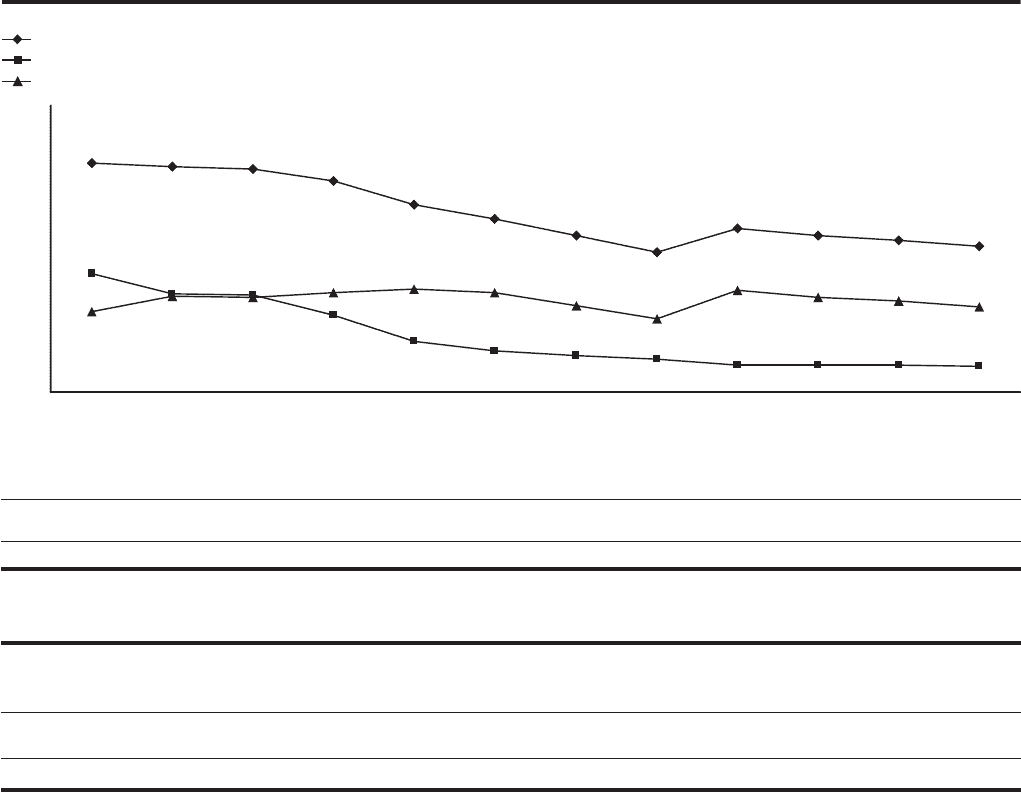
INTEREST REVENUE/EXPENSE AND YIELDS
6.32% 6.24% 6.18% 5.90%
5.35%
5.01%
4.63%
4.24%
4.78% 4.51%
4.61% 4.37%
3.75%
3.28% 3.23%
2.78%
2.16% 1.93% 1.83% 1.75% 1.60% 1.60% 1.60% 1.58%
2.86% 3.21% 3.19%
3.30% 3.38% 3.29% 2.99% 2.68%
3.35% 3.18% 3.09% 2.97%
1.00%
2.00%
3.00%
4.00%
5.00%
6.00%
7.00%
1Q08 2Q08 3Q08 4Q08 1Q09 2Q09 3Q09 4Q09 1Q10 2Q10 3Q10 4Q10
Interest Revenue-Average Rate
Interest Expense-Average Rate
Net Interest Margin
Average Rates
-
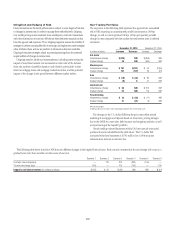
Interest Revenue, Interest Expense and Net Interest Margin
Interest RevenueAverage Rate
Interest ExpenseAverage Rate
Net Interest Margin
In millions of dollars 2010 2009 2008
Change
2010 vs. 2009
Change
2009 vs. 2008
Interest revenue $ 80,035 $ 77,306 $ 107,130 4% (28)%
Interest expense 24,864 27,700 52,682 (10) (47)
Net interest revenue (1)(2) $ 55,171 $ 49,606 $ 54,448 11% (9)%
Interest revenue—average rate 4.57% 4.80% 6.17% (23) bps (137) bps
Interest expense—average rate 1.59 1.92 3.27 (33) bps (135) bps
Net interest margin 3.15 3.08 3.13 7 bps (5) bps
Interest-rate benchmarks
Federal Funds rate—end of period 0.00–0.25% 0.00–0.25% 0.00–0.25% ——
Federal Funds rate—average rate 0.00–0.25 0.00–0.25 2.08 —(183+) bps
Two-year U.S. Treasury note—average rate 0.70% 0.96% 2.01% (26) bps (105) bps
10-year U.S. Treasury note—average rate 3.21 3.26 3.66 (5) bps (40) bps
10-year vs. two-year spread 251 bps 230 bps 165 bps
(1) Net interest revenue includes the taxable equivalent adjustments (based on the U.S. federal statutory tax rate of 35%) of $519 million, $692 million, and $699 million for 2010, 2009, and 2008, respectively.
(2) Excludes expenses associated with hybrid financial instruments and beneficial interest in consolidated VIEs. These obligations are classified as Long-term debt and accounted for at fair value with changes recorded in
Principal transactions.
A significant portion of Citi’s business activities are based upon gathering
deposits and borrowing money and then lending or investing those funds,
or participating in market making activities in tradable securities. The net
interest margin (NIM) is calculated by dividing gross interest revenue less
gross interest expense by average interest earning assets.
During 2010, NIM was positively impacted by the adoption of SFAS
166/167 as well as by the absence of interest on the $20 billion of TARP
trust preferred securities repaid at the end of 2009. However, the continued
de-risking of loan portfolios and run-off and sales of higher-yielding assets in
Citi Holdings, and investing the proceeds in lower-yielding securities with a
shorter duration, put pressure on NIM during 2010. See “Risk Factors” above.