Citibank 2010 Annual Report Download - page 153
Download and view the complete annual report
Please find page 153 of the 2010 Citibank annual report below. You can navigate through the pages in the report by either clicking on the pages listed below, or by using the keyword search tool below to find specific information within the annual report.-
 1
1 -
2
-
3
-
4
-
5
-
6
-
7
-
8
-
9
-
10
-
11
-
12
-
13
-
14
-
15
-
16
-
17
-
18
-
19
-
20
-
21
-
22
-
23
-
24
-
25
-
26
-
27
-
28
-
29
-
30
-
31
-
32
-
33
-
34
-
35
-
36
-
37
-
38
-
39
-
40
-
41
-
42
-
43
-
44
-
45
-
46
-
47
-
48
-
49
-
50
-
51
-
52
-
53
-
54
-
55
-
56
-
57
-
58
-
59
-
60
-
61
-
62
-
63
-
64
-
65
-
66
-
67
-
68
-
69
-
70
-
71
-
72
-
73
-
74
-
75
-
76
-
77
-
78
-
79
-
80
-
81
-
82
-
83
-
84
-
85
-
86
-
87
-
88
-
89
-
90
-
91
-
92
-
93
-
94
-
95
-
96
-
97
-
98
-
99
-
100
-
101
-
102
-
103
-
104
-
105
-
106
-
107
-
108
-
109
-
110
-
111
-
112
-
113
-
114
-
115
-
116
-
117
-
118
-
119
-
120
-
121
-
122
-
123
-
124
-
125
-
126
-
127
-
128
-
129
-
130
-
131
-
132
-
133
-
134
-
135
-
136
-
137
-
138
-
139
-
140
-
141
-
142
-
 143
143 -
 144
144 -
 145
145 -
 146
146 -
 147
147 -
 148
148 -
 149
149 -
 150
150 -
 151
151 -
 152
152 -
 153
153 -
 154
154 -
 155
155 -
 156
156 -
 157
157 -
 158
158 -
 159
159 -
 160
160 -
 161
161 -
 162
162 -
 163
163 -
164
-
165
-
166
-
167
-
168
-
169
-
170
-
171
-
172
-
173
-
174
-
175
-
176
-
177
-
178
-
179
-
180
-
181
-
182
-
183
-
184
-
185
-
186
-
187
-
188
-
189
-
190
-
191
-
192
-
193
-
194
-
195
-
196
-
197
-
198
-
199
-
200
-
201
-
202
-
203
-
204
-
205
-
206
-
207
-
208
-
209
-
210
-
211
-
212
-
213
-
214
-
215
-
216
-
217
-
218
-
219
-
220
-
221
-
222
-
223
-
224
-
225
-
226
-
227
-
228
-
229
-
230
-
231
-
232
-
233
-
234
-
235
-
236
-
237
-
238
-
239
-
240
-
241
-
242
-
243
-
244
-
245
-
246
-
247
-
248
-
249
-
250
-
251
-
252
-
253
-
254
-
255
-
256
-
257
-
258
-
259
-
260
-
261
-
262
-
263
-
264
-
265
-
266
-
267
-
268
-
269
-
270
-
271
-
272
-
273
-
274
-
275
-
276
-
277
-
278
-
279
-
280
-
281
-
282
-
283
-
284
-
285
-
286
-
287
-
288
-
289
-
290
-
291
-
292
-
293
-
294
-
295
-
296
-
297
-
298
-
299
-
300
-
301
-
302
-
303
-
304
-
305
-
306
-
307
-
308
-
309
-
310
-
311
-
312
 |
 |

151
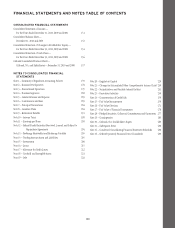
CONSOLIDATED FINANCIAL STATEMENTS
CONSOLIDATED STATEMENT OF INCOME Citigroup Inc. and Subsidiaries
Year ended December 31,
In millions of dollars, except per-share amounts 2010 2009 2008
Revenues
Interest revenue $ 79,516 $ 76,635 $106,499
Interest expense 24,864 27,721 52,750
Net interest revenue $ 54,652 $ 48,914 $ 53,749
Commissions and fees $ 13,658 $ 15,485 $ 12,855
Principal transactions 7,517 6,068 (23,889)
Administration and other fiduciary fees 4,005 5,195 8,222
Realized gains (losses) on sales of investments 2,411 1,996 679
Other than temporary impairment losses on investments (1)
Gross impairment losses (1,495) (7,262) (2,740)
Less: Impairments recognized in OCI 84 4,356 —
Net impairment losses recognized in earnings (1) (1,411) $ (2,906) $ (2,740)
Insurance premiums $ 2,684 $ 3,020 $ 3,221
Other revenue 3,085 2,513 (498)
Total non-interest revenues $ 31,949 $ 31,371 $ (2,150)
Total revenues, net of interest expense $ 86,601 $ 80,285 $ 51,599
Provisions for credit losses and for benefits and claims
Provision for loan losses $ 25,194 $ 38,760 $ 33,674
Policyholder benefits and claims 965 1,258 1,403
Provision for unfunded lending commitments (117) 244 (363)
Total provisions for credit losses and for benefits and claims $ 26,042 $ 40,262 $ 34,714
Operating expenses
Compensation and benefits $ 24,430 $ 24,987 $ 31,096
Premises and equipment 3,331 3,697 4,217
Technology/communication 4,924 5,215 7,093
Advertising and marketing 1,645 1,415 2,188
Restructuring —(113) 1,550
Other operating 13,045 12,621 23,096
Total operating expenses $ 47,375 $ 47,822 $ 69,240
Income (loss) from continuing operations before income taxes $ 13,184 $ (7,799) $ (52,355)
Provision (benefit) for income taxes 2,233 (6,733) (20,326)
Income (loss) from continuing operations $ 10,951 $ (1,066) $ (32,029)
Discontinued operations
Income (loss) from discontinued operations $ 72 $ (653) $ 784
Gain (loss) on sale (702) 102 3,139
Provision (benefit) for income taxes (562) (106) (79)
Income (loss) from discontinued operations, net of taxes $ (68) $ (445) $ 4,002
Net income (loss) before attribution of noncontrolling interests $ 10,883 $ (1,511) $ (28,027)
Net income (loss) attributable to noncontrolling interests 281 95 (343)
Citigroup’s net income (loss) $ 10,602 $ (1,606) $ (27,684)
Basic earnings per share (2)
Income (loss) from continuing operations $ 0.37 $ (0.76) $ (6.39)
Income (loss) from discontinued operations, net of taxes (0.01) (0.04) 0.76
Net income (loss) $ 0.36 $ (0.80) $ (5.63)
Weighted average common shares outstanding 28,776.0 11,568.3 5,265.4
Diluted earnings per share (2)
Income (loss) from continuing operations $ 0.35 $ (0.76) $ (6.39)
Income (loss) from discontinued operations, net of taxes —(0.04) 0.76
Net income (loss) $ 0.35 $ (0.80) $ (5.63)
Adjusted weighted average common shares outstanding 29,678.1 12,099.3 5,768.9
(1) As of January 1, 2009, the Company adopted ASC 320-10-65, Investments—Debt and Equity Securities. The Company disclosed comparable information with the prior year in its 2009 periodic reports.
(2) The Diluted EPS calculation for 2009 and 2008 utilizes Basic shares and Income available to common shareholders (Basic) due to the negative Income available to common shareholders. Using actual Diluted shares
and Income available to common shareholders (Diluted) would result in anti-dilution.
See Notes to the Consolidated Financial Statements.