Citibank 2010 Annual Report Download - page 31
Download and view the complete annual report
Please find page 31 of the 2010 Citibank annual report below. You can navigate through the pages in the report by either clicking on the pages listed below, or by using the keyword search tool below to find specific information within the annual report.-
 1
1 -
2
-
3
-
4
-
5
-
6
-
7
-
8
-
9
-
10
-
11
-
12
-
13
-
14
-
15
-
16
-
17
-
18
-
19
-
20
-
 21
21 -
 22
22 -
 23
23 -
 24
24 -
 25
25 -
 26
26 -
 27
27 -
 28
28 -
 29
29 -
 30
30 -
 31
31 -
 32
32 -
 33
33 -
 34
34 -
 35
35 -
 36
36 -
 37
37 -
 38
38 -
 39
39 -
 40
40 -
 41
41 -
42
-
43
-
44
-
45
-
46
-
47
-
48
-
49
-
50
-
51
-
52
-
53
-
54
-
55
-
56
-
57
-
58
-
59
-
60
-
61
-
62
-
63
-
64
-
65
-
66
-
67
-
68
-
69
-
70
-
71
-
72
-
73
-
74
-
75
-
76
-
77
-
78
-
79
-
80
-
81
-
82
-
83
-
84
-
85
-
86
-
87
-
88
-
89
-
90
-
91
-
92
-
93
-
94
-
95
-
96
-
97
-
98
-
99
-
100
-
101
-
102
-
103
-
104
-
105
-
106
-
107
-
108
-
109
-
110
-
111
-
112
-
113
-
114
-
115
-
116
-
117
-
118
-
119
-
120
-
121
-
122
-
123
-
124
-
125
-
126
-
127
-
128
-
129
-
130
-
131
-
132
-
133
-
134
-
135
-
136
-
137
-
138
-
139
-
140
-
141
-
142
-
143
-
144
-
145
-
146
-
147
-
148
-
149
-
150
-
151
-
152
-
153
-
154
-
155
-
156
-
157
-
158
-
159
-
160
-
161
-
162
-
163
-
164
-
165
-
166
-
167
-
168
-
169
-
170
-
171
-
172
-
173
-
174
-
175
-
176
-
177
-
178
-
179
-
180
-
181
-
182
-
183
-
184
-
185
-
186
-
187
-
188
-
189
-
190
-
191
-
192
-
193
-
194
-
195
-
196
-
197
-
198
-
199
-
200
-
201
-
202
-
203
-
204
-
205
-
206
-
207
-
208
-
209
-
210
-
211
-
212
-
213
-
214
-
215
-
216
-
217
-
218
-
219
-
220
-
221
-
222
-
223
-
224
-
225
-
226
-
227
-
228
-
229
-
230
-
231
-
232
-
233
-
234
-
235
-
236
-
237
-
238
-
239
-
240
-
241
-
242
-
243
-
244
-
245
-
246
-
247
-
248
-
249
-
250
-
251
-
252
-
253
-
254
-
255
-
256
-
257
-
258
-
259
-
260
-
261
-
262
-
263
-
264
-
265
-
266
-
267
-
268
-
269
-
270
-
271
-
272
-
273
-
274
-
275
-
276
-
277
-
278
-
279
-
280
-
281
-
282
-
283
-
284
-
285
-
286
-
287
-
288
-
289
-
290
-
291
-
292
-
293
-
294
-
295
-
296
-
297
-
298
-
299
-
300
-
301
-
302
-
303
-
304
-
305
-
306
-
307
-
308
-
309
-
310
-
311
-
312
 |
 |

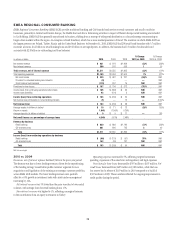
29
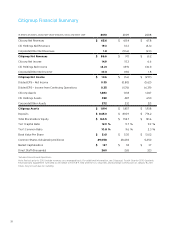
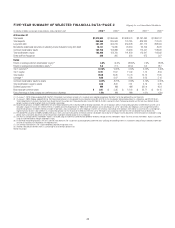
In millions of dollars, except per-share amounts, ratios and direct staff 2010 (1) 2009 (2) 2008 (2) 2007 (2) 2006 (2)
At December 31
Total assets $1,913,902 $1,856,646 $1,938,470 $2,187,480 $1,884,167
Total deposits 844,968 835,903 774,185 826,230 712,041
Long-term debt 381,183 364,019 359,593 427,112 288,494
Mandatorily redeemable securities of subsidiary trusts (included in long-term debt) 18,131 19,345 24,060 23,756 8,972
Common stockholders’ equity 163,156 152,388 70,966 113,447 118,632
Total stockholders’ equity 163,468 152,700 141,630 113,447 119,632
Direct staff (in thousands) 260 265 323 375 327
Ratios
Return on average common stockholders’ equity (5) 6.8% (9.4)% (28.8)% 2.9% 18.8%
Return on average total stockholders’ equity (5) 6.8 (1.1) (20.9) 3.0 18.7
Tier 1 Common (6) 10.75% 9.60% 2.30% 5.02% 7.49%
Tier 1 Capital 12.91 11.67 11.92 7.12 8.59
Total Capital 16.59 15.25 15.70 10.70 11.65
Leverage (7) 6.60 6.87 6.08 4.03 5.16
Common stockholders’ equity to assets 8.52% 8.21% 3.66% 5.19% 6.30%
Total stockholders’ equity to assets 8.54 8.22 7.31 5.19 6.35
Dividend payout ratio (8) NM NM NM 322.4 45.9
Book value per common share $ 5.61 $ 5.35 $ 13.02 $ 22.71 $ 24.15
Ratio of earnings to fixed charges and preferred stock dividends 1.52x NM NM 1.01x 1.50x
(1) On January 1, 2010, Citigroup adopted SFAS 166/167. Prior periods have not been restated as the standards were adopted prospectively. See Note 1 to the Consolidated Financial Statements.
(2) On January 1, 2009, Citigroup adopted SFAS No. 160, Noncontrolling Interests in Consolidated Financial Statements (now ASC 810-10-45-15, Consolidation: Noncontrolling Interest in a Subsidiary), and FSP EITF 03-6-1,
“Determining Whether Instruments Granted in Share-Based Payment Transactions Are Participating Securities” (now ASC 260-10-45-59A, Earnings Per Share: Participating Securities and the Two-Class Method). All prior
periods have been restated to conform to the current period’s presentation.
(3) Discontinued operations for 2006 to 2009 reflect the sale of Nikko Cordial Securities to Sumitomo Mitsui Banking Corporation, the sale of Citigroup’s German retail banking operations to Crédit Mutuel, and the sale of
CitiCapital’s equipment finance unit to General Electric. In addition, discontinued operations for 2006 include the operations and associated gain on sale of substantially all of Citigroup’s asset management business.
Discontinued operations for 2006 to 2010 also include the operations and associated gain on sale of Citigroup’s Travelers Life & Annuity; substantially all of Citigroup’s international insurance business; and Citigroup’s
Argentine pension business sold to MetLife Inc. Discontinued operations for the second half of 2010 also reflect the sale of The Student Loan Corporation. See Note 3 to the Consolidated Financial Statements.
(4) The diluted EPS calculation for 2009 and 2008 utilizes basic shares and income allocated to unrestricted common stockholders (Basic) due to the negative income allocated to unrestricted common stockholders. Using
diluted shares and income allocated to unrestricted common stockholders (Diluted) would result in anti-dilution.
(5) The return on average common stockholders’ equity is calculated using net income less preferred stock dividends divided by average common stockholders’ equity. The return on total stockholders’ equity is calculated
using net income divided by average stockholders’ equity.
(6) As defined by the banking regulators, the Tier 1 Common ratio represents Tier 1 Capital less qualifying perpetual preferred stock, qualifying noncontrolling interests in subsidiaries and qualifying mandatorily redeemable
securities of subsidiary trusts divided by risk-weighted assets.
(7) The Leverage ratio represents Tier 1 Capital divided by adjusted average total assets.
(8) Dividends declared per common share as a percentage of net income per diluted share.
NM Not meaningful
FIVE-YEAR SUMMARY OF SELECTED FINANCIAL DATA—PAGE 2 Citigroup Inc. and Consolidated Subsidiaries