Citibank 2010 Annual Report Download - page 301
Download and view the complete annual report
Please find page 301 of the 2010 Citibank annual report below. You can navigate through the pages in the report by either clicking on the pages listed below, or by using the keyword search tool below to find specific information within the annual report.-
 1
1 -
2
-
3
-
4
-
5
-
6
-
7
-
8
-
9
-
10
-
11
-
12
-
13
-
14
-
15
-
16
-
17
-
18
-
19
-
20
-
21
-
22
-
23
-
24
-
25
-
26
-
27
-
28
-
29
-
30
-
31
-
32
-
33
-
34
-
35
-
36
-
37
-
38
-
39
-
40
-
41
-
42
-
43
-
44
-
45
-
46
-
47
-
48
-
49
-
50
-
51
-
52
-
53
-
54
-
55
-
56
-
57
-
58
-
59
-
60
-
61
-
62
-
63
-
64
-
65
-
66
-
67
-
68
-
69
-
70
-
71
-
72
-
73
-
74
-
75
-
76
-
77
-
78
-
79
-
80
-
81
-
82
-
83
-
84
-
85
-
86
-
87
-
88
-
89
-
90
-
91
-
92
-
93
-
94
-
95
-
96
-
97
-
98
-
99
-
100
-
101
-
102
-
103
-
104
-
105
-
106
-
107
-
108
-
109
-
110
-
111
-
112
-
113
-
114
-
115
-
116
-
117
-
118
-
119
-
120
-
121
-
122
-
123
-
124
-
125
-
126
-
127
-
128
-
129
-
130
-
131
-
132
-
133
-
134
-
135
-
136
-
137
-
138
-
139
-
140
-
141
-
142
-
143
-
144
-
145
-
146
-
147
-
148
-
149
-
150
-
151
-
152
-
153
-
154
-
155
-
156
-
157
-
158
-
159
-
160
-
161
-
162
-
163
-
164
-
165
-
166
-
167
-
168
-
169
-
170
-
171
-
172
-
173
-
174
-
175
-
176
-
177
-
178
-
179
-
180
-
181
-
182
-
183
-
184
-
185
-
186
-
187
-
188
-
189
-
190
-
191
-
192
-
193
-
194
-
195
-
196
-
197
-
198
-
199
-
200
-
201
-
202
-
203
-
204
-
205
-
206
-
207
-
208
-
209
-
210
-
211
-
212
-
213
-
214
-
215
-
216
-
217
-
218
-
219
-
220
-
221
-
222
-
223
-
224
-
225
-
226
-
227
-
228
-
229
-
230
-
231
-
232
-
233
-
234
-
235
-
236
-
237
-
238
-
239
-
240
-
241
-
242
-
243
-
244
-
245
-
246
-
247
-
248
-
249
-
250
-
251
-
252
-
253
-
254
-
255
-
256
-
257
-
258
-
259
-
260
-
261
-
262
-
263
-
264
-
265
-
266
-
267
-
268
-
269
-
270
-
271
-
272
-
273
-
274
-
275
-
276
-
277
-
278
-
279
-
280
-
281
-
282
-
283
-
284
-
285
-
286
-
287
-
288
-
289
-
290
-
 291
291 -
 292
292 -
 293
293 -
 294
294 -
 295
295 -
 296
296 -
 297
297 -
 298
298 -
 299
299 -
 300
300 -
 301
301 -
 302
302 -
 303
303 -
 304
304 -
 305
305 -
 306
306 -
 307
307 -
 308
308 -
 309
309 -
 310
310 -
 311
311 -
312
 |
 |

299
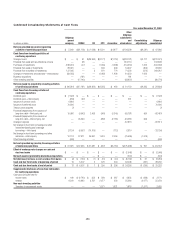
[End of Consolidated Financial Statements and Notes to Consolidated Financial Statements]
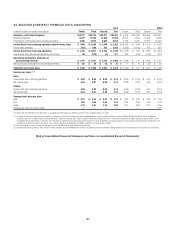
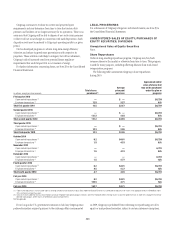
33. SELECTED QUARTERLY FINANCIAL DATA (UNAUDITED)
2010 2009 (1)
In millions of dollars, except per share amounts Fourth Third Second First Fourth Third Second First
Revenues, net of interest expense $18,371 $20,738 $22,071 $25,421 $ 5,405 $20,390 $29,969 $24,521
Operating expenses 12,471 11,520 11,866 11,518 12,314 11,824 11,999 11,685
Provisions for credit losses and for benefits and claims 4,840 5,919 6,665 8,618 8,184 9,095 12,676 10,307
Income (loss) from continuing operations before income taxes $ 1,060 $ 3,299 $ 3,540 $ 5,285 $(15,093) $ (529) $ 5,294 $ 2,529
Income taxes (benefits) (313) 698 812 1,036 (7,353) (1,122) 907 835
Income (loss) from continuing operations $ 1,373 $ 2,601 $ 2,728 $ 4,249 $ (7,740) $ 593 $ 4,387 $ 1,694
Income (loss) from discontinued operations, net of taxes 98 (374) (3) 211 232 (418) (142) (117)
Net income (loss) before attribution of
noncontrolling interests $ 1,471 $ 2,227 $ 2,725 $ 4,460 $ (7,508) $ 175 $ 4,245 $ 1,577
Net income (loss) attributable to noncontrolling interests $ 162 $ 59 $ 28 $ 32 $ 71 $ 74 $ (34) $ (16)
Citigroup’s net income (loss) $ 1,309 $ 2,168 $ 2,697 $ 4,428 $ (7,579) $ 101 $ 4,279 $ 1,593
Earnings per share (2) (3)
Basic
Income (loss) from continuing operations $ 0.04 $ 0.09 $ 0.09 $ 0.15 $ (0.34) $ (0.23) $ 0.51 $ (0.16)
Net income (loss) 0.04 0.07 0.09 0.15 (0.33) (0.27) 0.49 (0.18)
Diluted
Income (loss) from continuing operations 0.04 0.08 0.09 0.14 (0.34) (0.23) 0.51 (0.16)
Net income (loss) 0.04 0.07 0.09 0.15 (0.33) (0.27) 0.49 (0.18)
Common stock price per share
High $ 4.81 $ 4.30 $ 4.97 $ 4.31 $ 5.00 $ 5.23 $ 4.02 $ 7.46
Low 3.95 3.66 3.63 3.15 3.20 2.59 2.68 1.02
Close 4.73 3.91 3.76 4.05 3.31 4.84 2.97 2.53
Dividends per share of common stock — — — — — — — 0.01
This Note to the Consolidated Financial Statements is unaudited due to the Company’s individual quarterly results not being subject to an audit.
(1) The revenue and (after-tax impact) of the Company’s correction of a CVA error in prior periods, which reduced revenues and net income in the fourth quarter of 2009 by $840 million ($518 million), respectively,
related to the quarters in 2009 as follows: $198 million ($122 million), $115 million ($71 million) and $197 million ($121 million) for the first, second and third quarters of 2009, respectively. See also Note 1 to the
Consolidated Financial Statements. The impact of this CVA error was determined not to be material to the Company’s results of operations and financial position for any previously reported period. Consequently, in the
accompanying selected quarterly financial data, the cumulative effect through September 30, 2009 is recorded in the fourth quarter of 2009.
(2) Due to averaging of shares, quarterly earnings per share may not add up to the totals reported for the full year.
(3) Diluted shares are equal to basic shares for the first, third and fourth quarter of 2009 due to the net loss available to common shareholders. Adding additional shares to the denominator would result in anti-dilution.