Citibank 2010 Annual Report Download - page 270
Download and view the complete annual report
Please find page 270 of the 2010 Citibank annual report below. You can navigate through the pages in the report by either clicking on the pages listed below, or by using the keyword search tool below to find specific information within the annual report.-
 1
1 -
2
-
3
-
4
-
5
-
6
-
7
-
8
-
9
-
10
-
11
-
12
-
13
-
14
-
15
-
16
-
17
-
18
-
19
-
20
-
21
-
22
-
23
-
24
-
25
-
26
-
27
-
28
-
29
-
30
-
31
-
32
-
33
-
34
-
35
-
36
-
37
-
38
-
39
-
40
-
41
-
42
-
43
-
44
-
45
-
46
-
47
-
48
-
49
-
50
-
51
-
52
-
53
-
54
-
55
-
56
-
57
-
58
-
59
-
60
-
61
-
62
-
63
-
64
-
65
-
66
-
67
-
68
-
69
-
70
-
71
-
72
-
73
-
74
-
75
-
76
-
77
-
78
-
79
-
80
-
81
-
82
-
83
-
84
-
85
-
86
-
87
-
88
-
89
-
90
-
91
-
92
-
93
-
94
-
95
-
96
-
97
-
98
-
99
-
100
-
101
-
102
-
103
-
104
-
105
-
106
-
107
-
108
-
109
-
110
-
111
-
112
-
113
-
114
-
115
-
116
-
117
-
118
-
119
-
120
-
121
-
122
-
123
-
124
-
125
-
126
-
127
-
128
-
129
-
130
-
131
-
132
-
133
-
134
-
135
-
136
-
137
-
138
-
139
-
140
-
141
-
142
-
143
-
144
-
145
-
146
-
147
-
148
-
149
-
150
-
151
-
152
-
153
-
154
-
155
-
156
-
157
-
158
-
159
-
160
-
161
-
162
-
163
-
164
-
165
-
166
-
167
-
168
-
169
-
170
-
171
-
172
-
173
-
174
-
175
-
176
-
177
-
178
-
179
-
180
-
181
-
182
-
183
-
184
-
185
-
186
-
187
-
188
-
189
-
190
-
191
-
192
-
193
-
194
-
195
-
196
-
197
-
198
-
199
-
200
-
201
-
202
-
203
-
204
-
205
-
206
-
207
-
208
-
209
-
210
-
211
-
212
-
213
-
214
-
215
-
216
-
217
-
218
-
219
-
220
-
221
-
222
-
223
-
224
-
225
-
226
-
227
-
228
-
229
-
230
-
231
-
232
-
233
-
234
-
235
-
236
-
237
-
238
-
239
-
240
-
241
-
242
-
243
-
244
-
245
-
246
-
247
-
248
-
249
-
250
-
251
-
252
-
253
-
254
-
255
-
256
-
257
-
258
-
259
-
 260
260 -
 261
261 -
 262
262 -
 263
263 -
 264
264 -
 265
265 -
 266
266 -
 267
267 -
 268
268 -
 269
269 -
 270
270 -
 271
271 -
 272
272 -
 273
273 -
 274
274 -
 275
275 -
 276
276 -
 277
277 -
 278
278 -
 279
279 -
 280
280 -
281
-
282
-
283
-
284
-
285
-
286
-
287
-
288
-
289
-
290
-
291
-
292
-
293
-
294
-
295
-
296
-
297
-
298
-
299
-
300
-
301
-
302
-
303
-
304
-
305
-
306
-
307
-
308
-
309
-
310
-
311
-
312
 |
 |

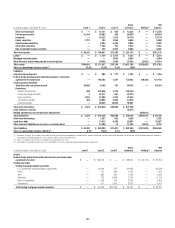
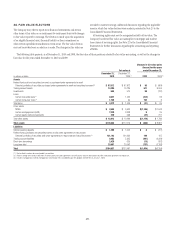
268
Net realized/unrealized
gains (losses) included in Transfers
in and/or
out of
Level 3
Purchases,
issuances
and
settlements
December 31,
2010
Unrealized
gains
(losses)
still held (3)
In millions of dollars
December 31,
2009
Principal
transactions Other (1)(2)
Loans $ 213 $ — $ (158) $ 1,217 $ 1,941 $3,213 $ (332)
Mortgage servicing rights 6,530 — (1,146) — (830) 4,554 (1,146)
Other financial assets measured on a
recurring basis 1,101 — (87) 2,022 (527) 2,509 (87)
Liabilities
Interest-bearing deposits $ 28 $ — $ 11 $ (41) $ 301 $ 277 $ (71)
Federal funds purchased and securities
loaned or sold under agreements
to repurchase 2,056 (28) — (878) 55 1,261 (104)
Trading account liabilities
Securities sold, not yet purchased 774 (39) — (47) (579) 187 (153)
Short-term borrowings 231 (6) — 614 (49) 802 (78)
Long-term debt 9,654 125 201 389 (1,332) 8,385 (225)
Other financial liabilities measured on a
recurring basis 13 — (52) — (46) 19 (20)
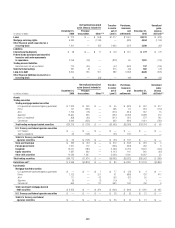
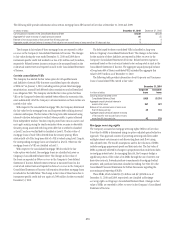
Net realized/unrealized
gains (losses) included in Transfers
in and/or
out of
Level 3
Purchases,
issuances
and
settlements
December 31,
2009
Unrealized
gains
(losses)
still held (3)
In millions of dollars
December 31,
2008
Principal
transactions Other (1)(2)
Assets
Trading securities
Trading mortgage-backed securities
U.S. government-sponsored agency guaranteed $ 1,325 $ 243 $ — $ 35 $ (631) $ 972 $ 317
Prime 147 (295) — 498 34 384 (179)
Alt-A 1,153 (78) — (374) (314) 387 73
Subprime 13,844 233 — (997) (4,082) 8,998 472
Non-U.S. residential 858 (23) — (617) 354 572 125
Commercial 2,949 (256) — 362 (604) 2,451 (762)
Total trading mortgage-backed securities $20,276 $ (176) $ — $(1,093) $(5,243) $13,764 $ 46
U.S. Treasury and federal agencies securities
U.S. Treasury $ — $ — $ — $ — $ — $ — $ —
Agency obligations 59 (108) — (54) 103 — —
Total U.S. Treasury and federal
agencies securities $ 59 $ (108) $ — $ (54) $ 103 $ — $ —
State and municipal $ 233 $ (67) $ — $ 219 $ (163) $ 222 $ 4
Foreign government 1,261 112 — (396) (518) 459 3
Corporate 13,027 (184) — (1,492) (2,731) 8,620 (449)
Equity securities 1,387 260 — (1,147) 140 640 (22)
Other debt securities 14,530 1,637 — (2,520) 2,590 16,237 53
Total trading securities $50,773 $ 1,474 $ — $(6,483) $(5,822) $39,942 $ (365)
Derivatives, net (4) $ 3,586 $(4,878) $ — $ 80 $ 4,320 $ 3,108 $(4,854)
Investments
Mortgage-backed securities
U.S. government-sponsored agency guaranteed $ — $ — $ 1 $ 77 $ (76) $ 2 $ —
Prime 1,163 — 201 61 (689) 736 417
Alt-A 111 — 42 (61) (37) 55 —
Subprime 25 — (7) (19) 2 1 —
Commercial 964 — 87 (461) 156 746 8
Total investment mortgage-backed
debt securities $ 2,263 $ — $ 324 $ (403) $ (644) $ 1,540 $ 425
U.S. Treasury and federal agencies securities $ — $ — $ — $ 26 $ (5) $ 21 $ —
Total U.S. Treasury and federal
agencies securities $ — $ — $ — $ 26 $ (5) $ 21 $ —