Citibank 2010 Annual Report Download - page 86
Download and view the complete annual report
Please find page 86 of the 2010 Citibank annual report below. You can navigate through the pages in the report by either clicking on the pages listed below, or by using the keyword search tool below to find specific information within the annual report.-
 1
1 -
 2
2 -
 3
3 -
 4
4 -
 5
5 -
 6
6 -
 7
7 -
 8
8 -
 9
9 -
 10
10 -
 11
11 -
 12
12 -
 13
13 -
 14
14 -
 15
15 -
 16
16 -
 17
17 -
 18
18 -
 19
19 -
 20
20 -
 21
21 -
 22
22 -
 23
23 -
 24
24 -
 25
25 -
 26
26 -
 27
27 -
 28
28 -
 29
29 -
 30
30 -
 31
31 -
 32
32 -
 33
33 -
 34
34 -
 35
35 -
 36
36 -
 37
37 -
 38
38 -
 39
39 -
 40
40 -
 41
41 -
 42
42 -
 43
43 -
 44
44 -
 45
45 -
 46
46 -
 47
47 -
 48
48 -
 49
49 -
 50
50 -
 51
51 -
 52
52 -
 53
53 -
 54
54 -
 55
55 -
 56
56 -
 57
57 -
 58
58 -
 59
59 -
 60
60 -
 61
61 -
 62
62 -
 63
63 -
 64
64 -
 65
65 -
 66
66 -
 67
67 -
 68
68 -
 69
69 -
 70
70 -
 71
71 -
 72
72 -
 73
73 -
 74
74 -
 75
75 -
 76
76 -
 77
77 -
 78
78 -
 79
79 -
 80
80 -
 81
81 -
 82
82 -
 83
83 -
 84
84 -
 85
85 -
 86
86 -
 87
87 -
 88
88 -
 89
89 -
 90
90 -
 91
91 -
 92
92 -
 93
93 -
 94
94 -
 95
95 -
 96
96 -
 97
97 -
 98
98 -
 99
99 -
 100
100 -
 101
101 -
 102
102 -
 103
103 -
 104
104 -
 105
105 -
 106
106 -
 107
107 -
 108
108 -
 109
109 -
 110
110 -
 111
111 -
 112
112 -
 113
113 -
 114
114 -
 115
115 -
 116
116 -
 117
117 -
 118
118 -
 119
119 -
 120
120 -
 121
121 -
 122
122 -
 123
123 -
 124
124 -
 125
125 -
 126
126 -
 127
127 -
 128
128 -
 129
129 -
 130
130 -
 131
131 -
 132
132 -
 133
133 -
 134
134 -
 135
135 -
 136
136 -
 137
137 -
 138
138 -
 139
139 -
 140
140 -
 141
141 -
 142
142 -
 143
143 -
 144
144 -
 145
145 -
 146
146 -
 147
147 -
 148
148 -
 149
149 -
 150
150 -
 151
151 -
 152
152 -
 153
153 -
 154
154 -
 155
155 -
 156
156 -
 157
157 -
 158
158 -
 159
159 -
 160
160 -
 161
161 -
 162
162 -
 163
163 -
 164
164 -
 165
165 -
 166
166 -
 167
167 -
 168
168 -
 169
169 -
 170
170 -
 171
171 -
 172
172 -
 173
173 -
 174
174 -
 175
175 -
 176
176 -
 177
177 -
 178
178 -
 179
179 -
 180
180 -
 181
181 -
 182
182 -
 183
183 -
 184
184 -
 185
185 -
 186
186 -
 187
187 -
 188
188 -
 189
189 -
 190
190 -
 191
191 -
 192
192 -
 193
193 -
 194
194 -
 195
195 -
 196
196 -
 197
197 -
 198
198 -
 199
199 -
 200
200 -
 201
201 -
 202
202 -
 203
203 -
 204
204 -
 205
205 -
 206
206 -
 207
207 -
 208
208 -
 209
209 -
 210
210 -
 211
211 -
 212
212 -
 213
213 -
 214
214 -
 215
215 -
 216
216 -
 217
217 -
 218
218 -
 219
219 -
 220
220 -
 221
221 -
 222
222 -
 223
223 -
 224
224 -
 225
225 -
 226
226 -
 227
227 -
 228
228 -
 229
229 -
 230
230 -
 231
231 -
 232
232 -
 233
233 -
 234
234 -
 235
235 -
 236
236 -
 237
237 -
 238
238 -
 239
239 -
 240
240 -
 241
241 -
 242
242 -
 243
243 -
 244
244 -
 245
245 -
 246
246 -
 247
247 -
 248
248 -
 249
249 -
 250
250 -
 251
251 -
 252
252 -
 253
253 -
 254
254 -
 255
255 -
 256
256 -
 257
257 -
 258
258 -
 259
259 -
 260
260 -
 261
261 -
 262
262 -
 263
263 -
 264
264 -
 265
265 -
 266
266 -
 267
267 -
 268
268 -
 269
269 -
 270
270 -
 271
271 -
 272
272 -
 273
273 -
 274
274 -
 275
275 -
 276
276 -
 277
277 -
 278
278 -
 279
279 -
 280
280 -
 281
281 -
 282
282 -
 283
283 -
 284
284 -
 285
285 -
 286
286 -
 287
287 -
 288
288 -
 289
289 -
 290
290 -
 291
291 -
 292
292 -
 293
293 -
 294
294 -
 295
295 -
 296
296 -
 297
297 -
 298
298 -
 299
299 -
 300
300 -
 301
301 -
 302
302 -
 303
303 -
 304
304 -
 305
305 -
 306
306 -
 307
307 -
 308
308 -
 309
309 -
 310
310 -
 311
311 -
 312
312
 |
 |

84
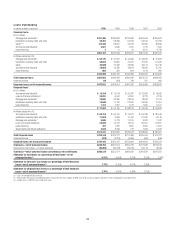
Loans Outstanding
In millions of dollars at year end 2010 2009 2008 2007 2006
Consumer loans
In U.S. offices
Mortgage and real estate (1) $151,469 $183,842 $219,482 $240,644 $208,592
Installment, revolving credit, and other 28,291 58,099 64,319 69,379 62,758
Cards (2)(3) 122,384 28,951 44,418 46,559 48,849
Commercial and industrial 5,021 5,640 7,041 7,716 7,595
Lease financing 211 31 3,151 4,743
$307,167 $276,543 $335,291 $367,449 $332,537
In offices outside the U.S.
Mortgage and real estate (1) $ 52,175 $ 47,297 $ 44,382 $ 49,326 $ 41,859
Installment, revolving credit, and other 38,024 42,805 41,272 70,205 61,509
Cards 40,948 41,493 42,586 46,176 30,745
Commercial and industrial 18,584 14,780 16,814 18,422 15,750
Lease financing 665 331 304 1,124 960
$150,396 $146,706 $145,358 $185,253 $150,823
Total Consumer loans $457,563 $423,249 $480,649 $552,702 $483,360
Unearned income 69 808 738 787 460
Consumer loans, net of unearned income $457,632 $424,057 $481,387 $553,489 $483,820
Corporate loans
In U.S. offices
Commercial and industrial $ 14,334 $ 15,614 $ 26,447 $ 20,696 $ 18,066
Loans to financial institutions (2) 29,813 6,947 10,200 8,778 4,126
Mortgage and real estate (1) 19,693 22,560 28,043 18,403 17,476
Installment, revolving credit, and other 12,640 17,737 22,050 26,539 17,051
Lease financing 1,413 1,297 1,476 1,630 2,101
$ 77,893 $ 64,155 $ 88,216 $ 76,046 $ 58,820
In offices outside the U.S.
Commercial and industrial $ 69,718 $ 66,747 $ 79,421 $ 94,188 $ 88,449
Installment, revolving credit, and other 11,829 9,683 17,441 21,037 14,146
Mortgage and real estate (1) 5,899 9,779 11,375 9,981 7,932
Loans to financial institutions 22,620 15,113 18,413 20,467 21,827
Lease financing 531 1,295 1,850 2,292 2,024
Governments and official institutions 3,644 2,949 773 1,029 2,523
$114,241 $105,566 $129,273 $148,994 $136,901
Total Corporate loans $192,134 $169,721 $217,489 $225,040 $195,721
Unearned income (972) (2,274) (4,660) (536) (349)
Corporate loans, net of unearned income $191,162 $167,447 $212,829 $224,504 $195,372
Total loans—net of unearned income $648,794 $591,504 $694,216 $777,993 $679,192
Allowance for loan losses—on drawn exposures (40,655) (36,033) (29,616) (16,117) (8,940)
Total loans—net of unearned income and allowance for credit losses $608,139 $555,471 $664,600 $761,876 $670,252
Allowance for loan losses as a percentage of total loans—net of
unearned income (3) 6.31% 6.09% 4.27% 2.07% 1.32%
Allowance for Consumer loan losses as a percentage of total Consumer
loans—net of unearned income (3) 7.77% 6.70% 4.61% 2.26%
Allowance for Corporate loan losses as a percentage of total Corporate
loans—net of unearned income (3) 2.76% 4.56% 3.48% 1.61%
(1) Loans secured primarily by real estate.
(2) 2010 includes the impact of consolidating entities in connection with Citi’s adoption of SFAS 167 (see discussion on page 24 and Note 1 to the Consolidated Financial Statements).
(3) Excludes loans in 2010 that are carried at fair value.
