Citibank 2010 Annual Report Download - page 253
Download and view the complete annual report
Please find page 253 of the 2010 Citibank annual report below. You can navigate through the pages in the report by either clicking on the pages listed below, or by using the keyword search tool below to find specific information within the annual report.-
 1
1 -
2
-
3
-
4
-
5
-
6
-
7
-
8
-
9
-
10
-
11
-
12
-
13
-
14
-
15
-
16
-
17
-
18
-
19
-
20
-
21
-
22
-
23
-
24
-
25
-
26
-
27
-
28
-
29
-
30
-
31
-
32
-
33
-
34
-
35
-
36
-
37
-
38
-
39
-
40
-
41
-
42
-
43
-
44
-
45
-
46
-
47
-
48
-
49
-
50
-
51
-
52
-
53
-
54
-
55
-
56
-
57
-
58
-
59
-
60
-
61
-
62
-
63
-
64
-
65
-
66
-
67
-
68
-
69
-
70
-
71
-
72
-
73
-
74
-
75
-
76
-
77
-
78
-
79
-
80
-
81
-
82
-
83
-
84
-
85
-
86
-
87
-
88
-
89
-
90
-
91
-
92
-
93
-
94
-
95
-
96
-
97
-
98
-
99
-
100
-
101
-
102
-
103
-
104
-
105
-
106
-
107
-
108
-
109
-
110
-
111
-
112
-
113
-
114
-
115
-
116
-
117
-
118
-
119
-
120
-
121
-
122
-
123
-
124
-
125
-
126
-
127
-
128
-
129
-
130
-
131
-
132
-
133
-
134
-
135
-
136
-
137
-
138
-
139
-
140
-
141
-
142
-
143
-
144
-
145
-
146
-
147
-
148
-
149
-
150
-
151
-
152
-
153
-
154
-
155
-
156
-
157
-
158
-
159
-
160
-
161
-
162
-
163
-
164
-
165
-
166
-
167
-
168
-
169
-
170
-
171
-
172
-
173
-
174
-
175
-
176
-
177
-
178
-
179
-
180
-
181
-
182
-
183
-
184
-
185
-
186
-
187
-
188
-
189
-
190
-
191
-
192
-
193
-
194
-
195
-
196
-
197
-
198
-
199
-
200
-
201
-
202
-
203
-
204
-
205
-
206
-
207
-
208
-
209
-
210
-
211
-
212
-
213
-
214
-
215
-
216
-
217
-
218
-
219
-
220
-
221
-
222
-
223
-
224
-
225
-
226
-
227
-
228
-
229
-
230
-
231
-
232
-
233
-
234
-
235
-
236
-
237
-
238
-
239
-
240
-
241
-
242
-
 243
243 -
 244
244 -
 245
245 -
 246
246 -
 247
247 -
 248
248 -
 249
249 -
 250
250 -
 251
251 -
 252
252 -
 253
253 -
 254
254 -
 255
255 -
 256
256 -
 257
257 -
 258
258 -
 259
259 -
 260
260 -
 261
261 -
 262
262 -
 263
263 -
264
-
265
-
266
-
267
-
268
-
269
-
270
-
271
-
272
-
273
-
274
-
275
-
276
-
277
-
278
-
279
-
280
-
281
-
282
-
283
-
284
-
285
-
286
-
287
-
288
-
289
-
290
-
291
-
292
-
293
-
294
-
295
-
296
-
297
-
298
-
299
-
300
-
301
-
302
-
303
-
304
-
305
-
306
-
307
-
308
-
309
-
310
-
311
-
312
 |
 |

251
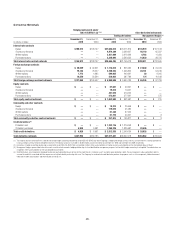
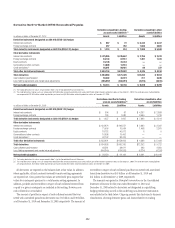
Derivative Notionals
Hedging instruments under
ASC 815 (SFAS 133)
(1)(2) Other derivative instruments
Trading derivatives Management hedges (3)
In millions of dollars
December 31,
2010
December 31,
2009
December 31,
2010
December 31,
2009
December 31,
2010
December 31,
2009
Interest rate contracts
Swaps $155,972 $128,797 $27,084,014 $20,571,814 $135,979 $107,193
Futures and forwards ——4,874,209 3,366,927 46,140 65,597
Written options ——3,431,608 3,616,240 8,762 11,050
Purchased options ——3,305,664 3,590,032 18,030 28,725
Total interest rate contract notionals $155,972 $128,797 $38,695,495 $31,145,013 $208,911 $212,565
Foreign exchange contracts
Swaps $ 29,599 $ 42,621 $ 1,118,610 $ 855,560 $ 27,830 $ 24,044
Futures and forwards 79,168 76,507 2,745,922 1,946,802 28,191 54,249
Written options 1,772 4,685 599,025 409,991 50 9,305
Purchased options 16,559 22,594 536,032 387,786 174 10,188
Total foreign exchange contract notionals $127,098 $146,407 $ 4,999,589 $ 3,600,139 $ 56,245 $ 97,786
Equity contracts
Swaps $ — $ — $ 67,637 $ 59,391 $ — $ —
Futures and forwards ——19,816 14,627 ——
Written options ——491,519 410,002 ——
Purchased options ——473,621 377,961 —275
Total equity contract notionals $ — $ — $ 1,052,593 $ 861,981 $ — $ 275
Commodity and other contracts
Swaps $ — $ — $ 19,213 $ 25,956 $ — $ —
Futures and forwards ——115,578 91,582 ——
Written options ——61,248 37,952 ——
Purchased options ——61,776 40,321 —3
Total commodity and other contract notionals $ — $ — $ 257,815 $ 195,811 $ — $ 3
Credit derivatives (4)
Protection sold $ — $ — $ 1,223,116 $ 1,214,053 $ — $ —
Protection purchased 4,928 6,981 1,289,239 1,325,981 28,526 —
Total credit derivatives $ 4,928 $ 6,981 $ 2,512,355 $ 2,540,034 $ 28,526 $ —
Total derivative notionals $ 287,998 $282,185 $47,517,847 $38,342,978 $293,682 $310,629
(1) The notional amounts presented in this table do not include hedge accounting relationships under ASC 815 (SFAS 133) where Citigroup is hedging the foreign currency risk of a net investment in a foreign operation by
issuing a foreign-currency-denominated debt instrument. The notional amount of such debt is $8,023 million and $7,442 million at December 31, 2010 and December 31, 2009, respectively.
(2) Derivatives in hedge accounting relationships accounted for under ASC 815 (SFAS 133) are recorded in either Other assets/liabilities or Trading account assets/liabilities on the Consolidated Balance Sheet.
(3) Management hedges represent derivative instruments used in certain economic hedging relationships that are identified for management purposes, but for which hedge accounting is not applied. These derivatives are
recorded in Other assets/liabilities on the Consolidated Balance Sheet.
(4) Credit derivatives are arrangements designed to allow one party (protection buyer) to transfer the credit risk of a “reference asset” to another party (protection seller). These arrangements allow a protection seller to
assume the credit risk associated with the reference asset without directly purchasing that asset. The Company has entered into credit derivative positions for purposes such as risk management, yield enhancement,
reduction of credit concentrations and diversification of overall risk.