Citibank 2010 Annual Report Download - page 48
Download and view the complete annual report
Please find page 48 of the 2010 Citibank annual report below. You can navigate through the pages in the report by either clicking on the pages listed below, or by using the keyword search tool below to find specific information within the annual report.-
 1
1 -
2
-
3
-
4
-
5
-
6
-
7
-
8
-
9
-
10
-
11
-
12
-
13
-
14
-
15
-
16
-
17
-
18
-
19
-
20
-
21
-
22
-
23
-
24
-
25
-
26
-
27
-
28
-
29
-
30
-
31
-
32
-
33
-
34
-
35
-
36
-
37
-
 38
38 -
 39
39 -
 40
40 -
 41
41 -
 42
42 -
 43
43 -
 44
44 -
 45
45 -
 46
46 -
 47
47 -
 48
48 -
 49
49 -
 50
50 -
 51
51 -
 52
52 -
 53
53 -
 54
54 -
 55
55 -
 56
56 -
 57
57 -
 58
58 -
59
-
60
-
61
-
62
-
63
-
64
-
65
-
66
-
67
-
68
-
69
-
70
-
71
-
72
-
73
-
74
-
75
-
76
-
77
-
78
-
79
-
80
-
81
-
82
-
83
-
84
-
85
-
86
-
87
-
88
-
89
-
90
-
91
-
92
-
93
-
94
-
95
-
96
-
97
-
98
-
99
-
100
-
101
-
102
-
103
-
104
-
105
-
106
-
107
-
108
-
109
-
110
-
111
-
112
-
113
-
114
-
115
-
116
-
117
-
118
-
119
-
120
-
121
-
122
-
123
-
124
-
125
-
126
-
127
-
128
-
129
-
130
-
131
-
132
-
133
-
134
-
135
-
136
-
137
-
138
-
139
-
140
-
141
-
142
-
143
-
144
-
145
-
146
-
147
-
148
-
149
-
150
-
151
-
152
-
153
-
154
-
155
-
156
-
157
-
158
-
159
-
160
-
161
-
162
-
163
-
164
-
165
-
166
-
167
-
168
-
169
-
170
-
171
-
172
-
173
-
174
-
175
-
176
-
177
-
178
-
179
-
180
-
181
-
182
-
183
-
184
-
185
-
186
-
187
-
188
-
189
-
190
-
191
-
192
-
193
-
194
-
195
-
196
-
197
-
198
-
199
-
200
-
201
-
202
-
203
-
204
-
205
-
206
-
207
-
208
-
209
-
210
-
211
-
212
-
213
-
214
-
215
-
216
-
217
-
218
-
219
-
220
-
221
-
222
-
223
-
224
-
225
-
226
-
227
-
228
-
229
-
230
-
231
-
232
-
233
-
234
-
235
-
236
-
237
-
238
-
239
-
240
-
241
-
242
-
243
-
244
-
245
-
246
-
247
-
248
-
249
-
250
-
251
-
252
-
253
-
254
-
255
-
256
-
257
-
258
-
259
-
260
-
261
-
262
-
263
-
264
-
265
-
266
-
267
-
268
-
269
-
270
-
271
-
272
-
273
-
274
-
275
-
276
-
277
-
278
-
279
-
280
-
281
-
282
-
283
-
284
-
285
-
286
-
287
-
288
-
289
-
290
-
291
-
292
-
293
-
294
-
295
-
296
-
297
-
298
-
299
-
300
-
301
-
302
-
303
-
304
-
305
-
306
-
307
-
308
-
309
-
310
-
311
-
312
 |
 |

46
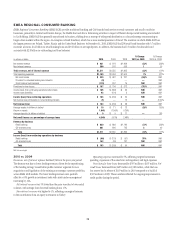
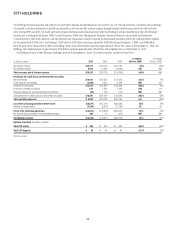
CITI HOLDINGS
Citi Holdings contains businesses and portfolios of assets that Citigroup has determined are not central to its core Citicorp businesses. Consistent with its strategy,
Citi intends to exit these businesses as quickly as practicable in an economically rational manner through business divestitures, portfolio run-offs and asset
sales. During 2009 and 2010, Citi made substantial progress divesting and exiting businesses from Citi Holdings, having completed more than 30 divestiture
transactions, including Smith Barney, Nikko Cordial Securities, Nikko Asset Management, Primerica Financial Services, various credit card businesses
(including Diners Club North America) and The Student Loan Corporation (which is reported as discontinued operations within the Corporate/Other segment
for the second half of 2010 only). Citi Holdings’ GAAP assets of $359 billion have been reduced by $128 billion from December 31, 2009, and $468 billion
from the peak in the first quarter of 2008. Citi Holdings’ GAAP assets of $359 billion represent approximately 19% of Citi’s assets as of December 31, 2010. Citi
Holdings’ risk-weighted assets of approximately $330 billion represent approximately 34% of Citi’s risk-weighted assets as of December 31, 2010.
Citi Holdings consists of the following: Brokerage and Asset Management, Local Consumer Lending, and Special Asset Pool.
In millions of dollars 2010 2009 2008
% Change
2010 vs. 2009
% Change
2009 vs. 2008
Net interest revenue $14,773 $ 16,139 $ 21,092 (8)% (23)%
Non-interest revenue 4,514 12,989 (29,330) (65) NM
Total revenues, net of interest expense $19,287 $ 29,128 $ (8,238) (34)% NM
Provisions for credit losses and for benefits and claims
Net credit losses $19,070 $ 24,585 $ 14,026 (22)% 75%
Credit reserve build (release) (3,500) 5,305 11,258 NM (53)
Provision for loan losses $15,570 $ 29,890 $ 25,284 (48)% 18%
Provision for benefits and claims 813 1,094 1,228 (26) (11)
Provision (release) for unfunded lending commitments (82) 106 (172) NM NM
Total provisions for credit losses and for benefits and claims $16,301 $ 31,090 $ 26,340 (48)% 18%
Total operating expenses $ 9,563 $ 13,764 $ 24,104 (31) (43)%
Loss from continuing operations before taxes $ (6,577) $(15,726) $(58,682) 58% 73%
Benefits for income taxes (2,554) (6,878) (22,185) 63 69
(Loss) from continuing operations $ (4,023) $ (8,848) $(36,497) 55% 76%
Net income (loss) attributable to noncontrolling interests 207 29 (372) NM NM
Citi Holdings net loss $ (4,230) $ (8,877) $(36,125) 52% 75%
Balance sheet data (in billions of dollars)
Total EOP assets $ 359 $ 487 $ 650 (26)% (25)%
Total EOP deposits $ 79 $ 89 $ 81 (11)% 10%
NM Not meaningful