Citibank 2010 Annual Report Download - page 295
Download and view the complete annual report
Please find page 295 of the 2010 Citibank annual report below. You can navigate through the pages in the report by either clicking on the pages listed below, or by using the keyword search tool below to find specific information within the annual report.-
 1
1 -
2
-
3
-
4
-
5
-
6
-
7
-
8
-
9
-
10
-
11
-
12
-
13
-
14
-
15
-
16
-
17
-
18
-
19
-
20
-
21
-
22
-
23
-
24
-
25
-
26
-
27
-
28
-
29
-
30
-
31
-
32
-
33
-
34
-
35
-
36
-
37
-
38
-
39
-
40
-
41
-
42
-
43
-
44
-
45
-
46
-
47
-
48
-
49
-
50
-
51
-
52
-
53
-
54
-
55
-
56
-
57
-
58
-
59
-
60
-
61
-
62
-
63
-
64
-
65
-
66
-
67
-
68
-
69
-
70
-
71
-
72
-
73
-
74
-
75
-
76
-
77
-
78
-
79
-
80
-
81
-
82
-
83
-
84
-
85
-
86
-
87
-
88
-
89
-
90
-
91
-
92
-
93
-
94
-
95
-
96
-
97
-
98
-
99
-
100
-
101
-
102
-
103
-
104
-
105
-
106
-
107
-
108
-
109
-
110
-
111
-
112
-
113
-
114
-
115
-
116
-
117
-
118
-
119
-
120
-
121
-
122
-
123
-
124
-
125
-
126
-
127
-
128
-
129
-
130
-
131
-
132
-
133
-
134
-
135
-
136
-
137
-
138
-
139
-
140
-
141
-
142
-
143
-
144
-
145
-
146
-
147
-
148
-
149
-
150
-
151
-
152
-
153
-
154
-
155
-
156
-
157
-
158
-
159
-
160
-
161
-
162
-
163
-
164
-
165
-
166
-
167
-
168
-
169
-
170
-
171
-
172
-
173
-
174
-
175
-
176
-
177
-
178
-
179
-
180
-
181
-
182
-
183
-
184
-
185
-
186
-
187
-
188
-
189
-
190
-
191
-
192
-
193
-
194
-
195
-
196
-
197
-
198
-
199
-
200
-
201
-
202
-
203
-
204
-
205
-
206
-
207
-
208
-
209
-
210
-
211
-
212
-
213
-
214
-
215
-
216
-
217
-
218
-
219
-
220
-
221
-
222
-
223
-
224
-
225
-
226
-
227
-
228
-
229
-
230
-
231
-
232
-
233
-
234
-
235
-
236
-
237
-
238
-
239
-
240
-
241
-
242
-
243
-
244
-
245
-
246
-
247
-
248
-
249
-
250
-
251
-
252
-
253
-
254
-
255
-
256
-
257
-
258
-
259
-
260
-
261
-
262
-
263
-
264
-
265
-
266
-
267
-
268
-
269
-
270
-
271
-
272
-
273
-
274
-
275
-
276
-
277
-
278
-
279
-
280
-
281
-
282
-
283
-
284
-
 285
285 -
 286
286 -
 287
287 -
 288
288 -
 289
289 -
 290
290 -
 291
291 -
 292
292 -
 293
293 -
 294
294 -
 295
295 -
 296
296 -
 297
297 -
 298
298 -
 299
299 -
 300
300 -
 301
301 -
 302
302 -
 303
303 -
 304
304 -
 305
305 -
306
-
307
-
308
-
309
-
310
-
311
-
312
 |
 |

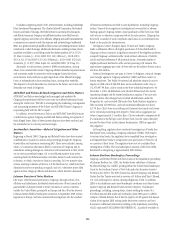
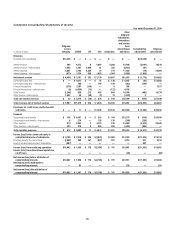
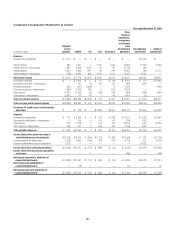
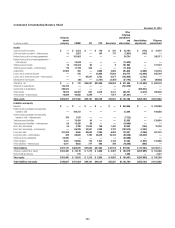
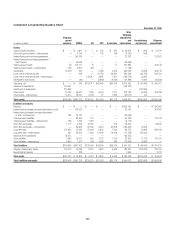
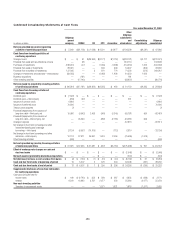
293
Condensed Consolidating Statements of Income
Year ended December 31, 2008
In millions of dollars
Citigroup
parent
company CGMHI CFI CCC Associates
Other
Citigroup
subsidiaries,
eliminations
and income
from
discontinued
operations
Consolidating
adjustments
Citigroup
consolidated
Revenues
Dividends from subsidiaries $ 1,788 $ — $ — $ — $ — $ — $ (1,788) $ —
Interest revenue 758 18,569 3 7,218 8,261 78,908 (7,218) 106,499
Interest revenue—intercompany 4,822 2,109 5,156 67 575 (12,662) (67) —
Interest expense 9,455 11,607 3,294 141 608 27,786 (141) 52,750
Interest expense—intercompany (306) 5,014 290 2,435 2,202 (7,200) (2,435) —
Net interest revenue $ (3,569) $ 4,057 $ 1,575 $ 4,709 $ 6,026 $ 45,660 $ (4,709) $ 53,749
Commissions and fees $ (1) $ 7,361 $ — $ 87 $ 182 $ 5,313 $ (87) $ 12,855
Commissions and fees—intercompany — 521 — 37 52 (573) (37) —
Principal transactions (159) (22,175) 5,261 — (6) (6,810) — (23,889)
Principal transactions—intercompany 962 479 (4,070) — 180 2,449 — —
Other income (6,253) 2,896 (174) 389 344 12,071 (389) 8,884
Other income—intercompany 6,521 2,635 187 27 69 (9,412) (27) —
Total non-interest revenues $ 1,070 $ (8,283) $ 1,204 $ 540 $ 821 $ 3,038 $ (540) $ (2,150)
Total revenues, net of interest expense $ (711) $ (4,226) $ 2,779 $ 5,249 $ 6,847 $ 48,698 $ (7,037) $ 51,599
Provisions for credit losses and for benefits
and claims $ — $ 381 $ — $ 4,638 $ 5,020 $ 29,313 $ (4,638) $ 34,714
Expenses
Compensation and benefits $ (150) $ 9,651 $ — $ 667 $ 906 $ 20,689 $ (667) $ 31,096
Compensation and benefits—intercompany 9 912 — 188 189 (1,110) (188) —
Other expense 219 4,206 3 663 1,260 32,456 (663) 38,144
Other expense—intercompany 594 1,828 51 451 498 (2,971) (451) —
Total operating expenses $ 672 $ 16,597 $ 54 $ 1,969 $ 2,853 $ 49,064 $ (1,969) $ 69,240
Income (loss) before taxes and equity in
undistributed income of subsidiaries $ (1,383) $(21,204) $ 2,725 $(1,358) $(1,026) $(29,679) $ (430) $ (52,355)
Provision (benefit) for income taxes (2,223) (8,463) 953 (526) (310) (10,283) 526 (20,326)
Equity in undistributed income of subsidiaries (29,122) — — — — — 29,122 —
Income (loss) from continuing operations $(28,282) $(12,741) $ 1,772 $ (832) $ (716) $(19,396) $28,166 $ (32,029)
Income from discontinued operations,
net of taxes 598 — — — — 3,404 — 4,002
Net income (loss) before attribution of
noncontrolling interests $(27,684) $(12,741) $ 1,772 $ (832) $ (716) $(15,992) $28,166 $ (28,027)
Net income (loss) attributable to
noncontrolling interests — (9) — — — (334) — (343)
Net income (loss) after attribution of
noncontrolling interests $(27,684) $(12,732) $ 1,772 $ (832) $ (716) $(15,658) $28,166 $ (27,684)