Citibank 2010 Annual Report Download - page 201
Download and view the complete annual report
Please find page 201 of the 2010 Citibank annual report below. You can navigate through the pages in the report by either clicking on the pages listed below, or by using the keyword search tool below to find specific information within the annual report.-
 1
1 -
2
-
3
-
4
-
5
-
6
-
7
-
8
-
9
-
10
-
11
-
12
-
13
-
14
-
15
-
16
-
17
-
18
-
19
-
20
-
21
-
22
-
23
-
24
-
25
-
26
-
27
-
28
-
29
-
30
-
31
-
32
-
33
-
34
-
35
-
36
-
37
-
38
-
39
-
40
-
41
-
42
-
43
-
44
-
45
-
46
-
47
-
48
-
49
-
50
-
51
-
52
-
53
-
54
-
55
-
56
-
57
-
58
-
59
-
60
-
61
-
62
-
63
-
64
-
65
-
66
-
67
-
68
-
69
-
70
-
71
-
72
-
73
-
74
-
75
-
76
-
77
-
78
-
79
-
80
-
81
-
82
-
83
-
84
-
85
-
86
-
87
-
88
-
89
-
90
-
91
-
92
-
93
-
94
-
95
-
96
-
97
-
98
-
99
-
100
-
101
-
102
-
103
-
104
-
105
-
106
-
107
-
108
-
109
-
110
-
111
-
112
-
113
-
114
-
115
-
116
-
117
-
118
-
119
-
120
-
121
-
122
-
123
-
124
-
125
-
126
-
127
-
128
-
129
-
130
-
131
-
132
-
133
-
134
-
135
-
136
-
137
-
138
-
139
-
140
-
141
-
142
-
143
-
144
-
145
-
146
-
147
-
148
-
149
-
150
-
151
-
152
-
153
-
154
-
155
-
156
-
157
-
158
-
159
-
160
-
161
-
162
-
163
-
164
-
165
-
166
-
167
-
168
-
169
-
170
-
171
-
172
-
173
-
174
-
175
-
176
-
177
-
178
-
179
-
180
-
181
-
182
-
183
-
184
-
185
-
186
-
187
-
188
-
189
-
190
-
 191
191 -
 192
192 -
 193
193 -
 194
194 -
 195
195 -
 196
196 -
 197
197 -
 198
198 -
 199
199 -
 200
200 -
 201
201 -
 202
202 -
 203
203 -
 204
204 -
 205
205 -
 206
206 -
 207
207 -
 208
208 -
 209
209 -
 210
210 -
 211
211 -
212
-
213
-
214
-
215
-
216
-
217
-
218
-
219
-
220
-
221
-
222
-
223
-
224
-
225
-
226
-
227
-
228
-
229
-
230
-
231
-
232
-
233
-
234
-
235
-
236
-
237
-
238
-
239
-
240
-
241
-
242
-
243
-
244
-
245
-
246
-
247
-
248
-
249
-
250
-
251
-
252
-
253
-
254
-
255
-
256
-
257
-
258
-
259
-
260
-
261
-
262
-
263
-
264
-
265
-
266
-
267
-
268
-
269
-
270
-
271
-
272
-
273
-
274
-
275
-
276
-
277
-
278
-
279
-
280
-
281
-
282
-
283
-
284
-
285
-
286
-
287
-
288
-
289
-
290
-
291
-
292
-
293
-
294
-
295
-
296
-
297
-
298
-
299
-
300
-
301
-
302
-
303
-
304
-
305
-
306
-
307
-
308
-
309
-
310
-
311
-
312
 |
 |

199
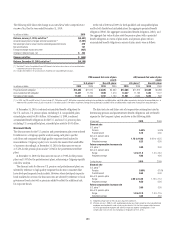
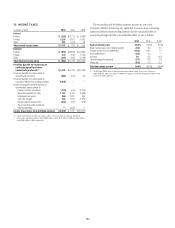
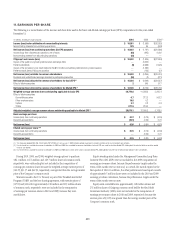
10. INCOME TAXES
In millions of dollars 2010 2009 2008
Current
Federal $ (249) $(1,711) $ (4,582)
Foreign 3,239 3,101 4,762
State 207 (414) 29
Total current income taxes $ 3,197 $ 976 $ 209
Deferred
Federal $ (933) $(6,892) $(16,583)
Foreign 279 (182) (1,794)
State (310) (635) (2,158)
Total deferred income taxes $ (964) $(7,709) $(20,535)
Provision (benefit) for income tax on
continuing operations before
noncontrolling interests (1) $ 2,233 $(6,733) $(20,326)
Provision (benefit) for income taxes on
discontinued operations (562) (106) (79)
Provision (benefit) for income taxes on
cumulative effect of accounting changes (4,978) — —
Income tax expense (benefit) reported in
stockholders’ equity related to:
Foreign currency translation (739) (415) (2,116)
Securities available-for-sale 1,167 2,765 (5,468)
Employee stock plans 600 1,351 449
Cash flow hedges 325 1,165 (1,354)
Pension liability adjustments (434) (513) (918)
Tax on exchange offer booked to
retained earnings —3,523 —
Income taxes before noncontrolling interests $(2,388) $ 1,037 $(29,812)
(1) Includes the effect of securities transactions and OTTI losses resulting in a provision (benefit) of
$844 million and $(494) million in 2010, $698 million and $(1,017) million in 2009 and $238 million
and $(959) million in 2008, respectively.
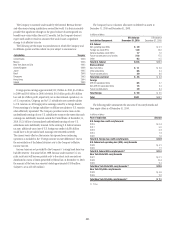
The reconciliation of the federal statutory income tax rate to the
Company’s effective income tax rate applicable to income from continuing
operations (before noncontrolling interests and the cumulative effect of
accounting changes) for the years ended December 31 was as follows:
2010 2009 2008
Federal statutory rate 35.0% 35.0% 35.0%
State income taxes, net of federal benefit (0.5) 8.4 2.7
Foreign income tax rate differential (10.0) 26.0 1.2
Audit settlements (1) (0.5) 4.4 —
Goodwill 0.1 0.5 (2.2)
Tax advantaged investments (6.7) 11.8 1.8
Other, net (0.5) 0.2 0.3
Effective income tax rate 16.9% 86.3% 38.8%
(1) For 2010 and 2009, relates to the conclusion of the audit of various issues in the Company’s
2003–2005 U.S. federal tax audit. For 2009, also includes a tax benefit relating to the release of tax
reserves on interchange fees.