Citibank 2010 Annual Report Download - page 59
Download and view the complete annual report
Please find page 59 of the 2010 Citibank annual report below. You can navigate through the pages in the report by either clicking on the pages listed below, or by using the keyword search tool below to find specific information within the annual report.-
 1
1 -
2
-
3
-
4
-
5
-
6
-
7
-
8
-
9
-
10
-
11
-
12
-
13
-
14
-
15
-
16
-
17
-
18
-
19
-
20
-
21
-
22
-
23
-
24
-
25
-
26
-
27
-
28
-
29
-
30
-
31
-
32
-
33
-
34
-
35
-
36
-
37
-
38
-
39
-
40
-
41
-
42
-
43
-
44
-
45
-
46
-
47
-
48
-
 49
49 -
 50
50 -
 51
51 -
 52
52 -
 53
53 -
 54
54 -
 55
55 -
 56
56 -
 57
57 -
 58
58 -
 59
59 -
 60
60 -
 61
61 -
 62
62 -
 63
63 -
 64
64 -
 65
65 -
 66
66 -
 67
67 -
 68
68 -
 69
69 -
70
-
71
-
72
-
73
-
74
-
75
-
76
-
77
-
78
-
79
-
80
-
81
-
82
-
83
-
84
-
85
-
86
-
87
-
88
-
89
-
90
-
91
-
92
-
93
-
94
-
95
-
96
-
97
-
98
-
99
-
100
-
101
-
102
-
103
-
104
-
105
-
106
-
107
-
108
-
109
-
110
-
111
-
112
-
113
-
114
-
115
-
116
-
117
-
118
-
119
-
120
-
121
-
122
-
123
-
124
-
125
-
126
-
127
-
128
-
129
-
130
-
131
-
132
-
133
-
134
-
135
-
136
-
137
-
138
-
139
-
140
-
141
-
142
-
143
-
144
-
145
-
146
-
147
-
148
-
149
-
150
-
151
-
152
-
153
-
154
-
155
-
156
-
157
-
158
-
159
-
160
-
161
-
162
-
163
-
164
-
165
-
166
-
167
-
168
-
169
-
170
-
171
-
172
-
173
-
174
-
175
-
176
-
177
-
178
-
179
-
180
-
181
-
182
-
183
-
184
-
185
-
186
-
187
-
188
-
189
-
190
-
191
-
192
-
193
-
194
-
195
-
196
-
197
-
198
-
199
-
200
-
201
-
202
-
203
-
204
-
205
-
206
-
207
-
208
-
209
-
210
-
211
-
212
-
213
-
214
-
215
-
216
-
217
-
218
-
219
-
220
-
221
-
222
-
223
-
224
-
225
-
226
-
227
-
228
-
229
-
230
-
231
-
232
-
233
-
234
-
235
-
236
-
237
-
238
-
239
-
240
-
241
-
242
-
243
-
244
-
245
-
246
-
247
-
248
-
249
-
250
-
251
-
252
-
253
-
254
-
255
-
256
-
257
-
258
-
259
-
260
-
261
-
262
-
263
-
264
-
265
-
266
-
267
-
268
-
269
-
270
-
271
-
272
-
273
-
274
-
275
-
276
-
277
-
278
-
279
-
280
-
281
-
282
-
283
-
284
-
285
-
286
-
287
-
288
-
289
-
290
-
291
-
292
-
293
-
294
-
295
-
296
-
297
-
298
-
299
-
300
-
301
-
302
-
303
-
304
-
305
-
306
-
307
-
308
-
309
-
310
-
311
-
312
 |
 |

57
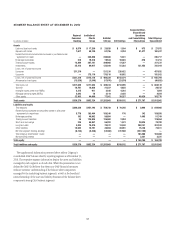
SEGMENT BALANCE SHEET AT DECEMBER 31, 2010
In millions of dollars
Regional
Consumer
Banking
Institutional
Clients
Group
Subtotal
Citicorp Citi Holdings
Corporate/Other,
Discontinued
Operations
and Consolidating
Eliminations
Total Citigroup
Consolidated
Assets
Cash and due from banks $ 8,576 $ 17,259 $ 25,835 $ 1,164 $ 973 $ 27,972
Deposits with banks 7,617 60,139 67,756 3,204 91,477 162,437
Federal funds sold and securities borrowed or purchased under
agreements to resell — 240,886 240,886 5,831 — 246,717
Brokerage receivables 218 19,316 19,534 10,803 876 31,213
Trading account assets 12,804 287,101 299,905 17,367 — 317,272
Investments 35,472 99,977 135,449 51,263 131,452 318,164
Loans, net of unearned income
Consumer 231,210 — 231,210 226,422 — 457,632
Corporate — 175,110 175,110 16,052 — 191,162
Loans, net of unearned income $231,210 $175,110 $ 406,320 $242,474 — $ 648,794
Allowance for loan losses (13,530) (3,546) (17,076) (23,579) — (40,655)
Total loans, net $217,680 $171,564 $ 389,244 $218,895 — $ 608,139
Goodwill 10,701 10,826 21,527 4,625 — 26,152
Intangible assets (other than MSRs) 2,215 971 3,186 4,318 — 7,504
Mortgage servicing rights (MSRs) 2,043 76 2,119 2,435 — 4,554
Other assets 32,953 44,609 77,562 39,287 46,929 163,778
Total assets $330,279 $952,724 $1,283,003 $359,192 $ 271,707 $1,913,902
Liabilities and equity
Total deposits $308,538 $451,192 $ 759,730 $ 79,248 $ 5,990 $ 844,968
Federal funds purchased and securities loaned or sold under
agreements to repurchase 5,776 183,464 189,240 176 142 189,558
Brokerage payables 192 49,862 50,054 — 1,695 51,749
Trading account liabilities 25 126,935 126,960 2,094 — 129,054
Short-term borrowings 336 55,957 56,293 1,573 20,924 78,790
Long-term debt 3,033 75,479 78,512 13,530 289,141 381,183
Other liabilities 18,503 18,191 36,694 20,991 15,126 72,811
Net inter-segment funding (lending) (6,124) (8,356) (14,480) 241,580 (227,100) —
Total Citigroup stockholders’ equity — — — — 163,468 163,468
Noncontrolling interest — — — — 2,321 2,321
Total equity — — — — $ 165,789 $ 165,789
Total liabilities and equity $330,279 $952,724 $1,283,003 $359,192 $ 271,707 $1,913,902
The supplemental information presented above reflects Citigroup’s
consolidated GAAP balance sheet by reporting segment as of December 31,
2010. The respective segment information depicts the assets and liabilities
managed by each segment as of such date. While this presentation is not
defined by GAAP, Citi believes that these non-GAAP financial measures
enhance investors’ understanding of the balance sheet components
managed by the underlying business segments, as well as the beneficial
inter-relationship of the asset and liability dynamics of the balance sheet
components among Citi’s business segments.