Citibank 2010 Annual Report Download - page 218
Download and view the complete annual report
Please find page 218 of the 2010 Citibank annual report below. You can navigate through the pages in the report by either clicking on the pages listed below, or by using the keyword search tool below to find specific information within the annual report.-
 1
1 -
2
-
3
-
4
-
5
-
6
-
7
-
8
-
9
-
10
-
11
-
12
-
13
-
14
-
15
-
16
-
17
-
18
-
19
-
20
-
21
-
22
-
23
-
24
-
25
-
26
-
27
-
28
-
29
-
30
-
31
-
32
-
33
-
34
-
35
-
36
-
37
-
38
-
39
-
40
-
41
-
42
-
43
-
44
-
45
-
46
-
47
-
48
-
49
-
50
-
51
-
52
-
53
-
54
-
55
-
56
-
57
-
58
-
59
-
60
-
61
-
62
-
63
-
64
-
65
-
66
-
67
-
68
-
69
-
70
-
71
-
72
-
73
-
74
-
75
-
76
-
77
-
78
-
79
-
80
-
81
-
82
-
83
-
84
-
85
-
86
-
87
-
88
-
89
-
90
-
91
-
92
-
93
-
94
-
95
-
96
-
97
-
98
-
99
-
100
-
101
-
102
-
103
-
104
-
105
-
106
-
107
-
108
-
109
-
110
-
111
-
112
-
113
-
114
-
115
-
116
-
117
-
118
-
119
-
120
-
121
-
122
-
123
-
124
-
125
-
126
-
127
-
128
-
129
-
130
-
131
-
132
-
133
-
134
-
135
-
136
-
137
-
138
-
139
-
140
-
141
-
142
-
143
-
144
-
145
-
146
-
147
-
148
-
149
-
150
-
151
-
152
-
153
-
154
-
155
-
156
-
157
-
158
-
159
-
160
-
161
-
162
-
163
-
164
-
165
-
166
-
167
-
168
-
169
-
170
-
171
-
172
-
173
-
174
-
175
-
176
-
177
-
178
-
179
-
180
-
181
-
182
-
183
-
184
-
185
-
186
-
187
-
188
-
189
-
190
-
191
-
192
-
193
-
194
-
195
-
196
-
197
-
198
-
199
-
200
-
201
-
202
-
203
-
204
-
205
-
206
-
207
-
 208
208 -
 209
209 -
 210
210 -
 211
211 -
 212
212 -
 213
213 -
 214
214 -
 215
215 -
 216
216 -
 217
217 -
 218
218 -
 219
219 -
 220
220 -
 221
221 -
 222
222 -
 223
223 -
 224
224 -
 225
225 -
 226
226 -
 227
227 -
 228
228 -
229
-
230
-
231
-
232
-
233
-
234
-
235
-
236
-
237
-
238
-
239
-
240
-
241
-
242
-
243
-
244
-
245
-
246
-
247
-
248
-
249
-
250
-
251
-
252
-
253
-
254
-
255
-
256
-
257
-
258
-
259
-
260
-
261
-
262
-
263
-
264
-
265
-
266
-
267
-
268
-
269
-
270
-
271
-
272
-
273
-
274
-
275
-
276
-
277
-
278
-
279
-
280
-
281
-
282
-
283
-
284
-
285
-
286
-
287
-
288
-
289
-
290
-
291
-
292
-
293
-
294
-
295
-
296
-
297
-
298
-
299
-
300
-
301
-
302
-
303
-
304
-
305
-
306
-
307
-
308
-
309
-
310
-
311
-
312
 |
 |

216
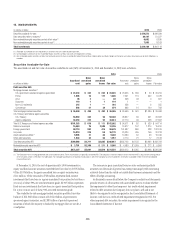
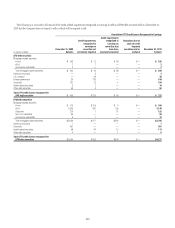
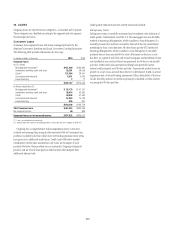
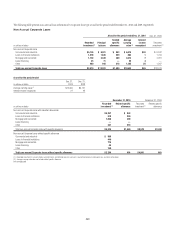
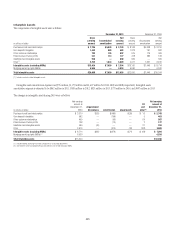
The following table provides details on Citigroup’s Consumer loan delinquency and non-accrual loans as of December 31, 2010:
Consumer Loan Delinquency and Non-Accrual Details at December 31, 2010
In millions of dollars
30–89 days
past due (1)
≥ 90 days
past due
(2)
90 days past due
and accruing
(3)
Total
non-accrual
Total
current (4)(5)
Total
loans (5)
In North America offices
First mortgages $ 4,809 $ 5,937 $ 5,405 $5,979 $ 81,105 $ 98,854
Home equity loans (6) 639 1,010 — 972 44,306 45,955
Credit cards 3,290 3,207 3,207 — 117,496 123,993
Installment and other 1,500 1,126 344 1,014 29,665 32,291
Commercial market loans 172 157 — 574 9,952 10,281
Total $10,410 $11,437 $ 8,956 $ 8,539 $282,524 $311,374
In offices outside North America
First mortgages $ 657 $ 573 $ — $ 774 $ 41,852 $ 43,082
Home equity loans (6) 2 4 — 6 188 194
Credit cards 1,116 974 409 564 40,806 42,896
Installment and other 823 291 41 635 30,790 31,904
Commercial market loans 61 186 1 278 27,935 28,182
Total $ 2,659 $ 2,028 $ 451 $2,257 $141,571 $146,258
(1) Excludes $1.6 billion of first mortgages that are guaranteed by U.S. government agencies.
(2) Excludes $5.4 billion of first mortgages that are guaranteed by U.S. government agencies.
(3) Installment and other balances are primarily student loans which are insured by U.S. government agencies under the Federal Family Education Loan Program.
(4) Loans less than 30 days past due are considered current.
(5) Includes $1.7 billion of first mortgage loans recorded at fair value.
(6) Fixed rate home equity loans and loans extended under home equity lines of credit which are typically in junior lien positions.
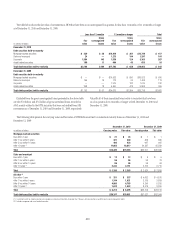
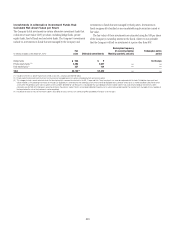
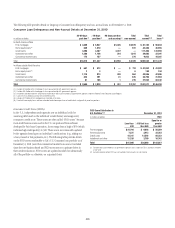
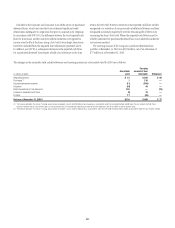
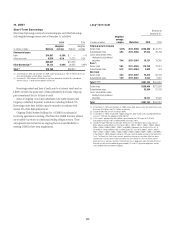
Consumer Credit Scores (FICOs)
In the U.S., independent credit agencies rate an individual’s risk for
assuming debt based on the individual’s credit history and assign every
consumer a credit score. These scores are often called “FICO scores” because
most credit bureau scores used in the U.S. are produced from software
developed by Fair Isaac Corporation. Scores range from a high of 850 (which
indicates high credit quality) to 300. These scores are continually updated
by the agencies based upon an individual’s credit actions (e.g., taking out
a loan, missed or late payments, etc.). The following table provides details
on the FICO scores attributable to Citi’s U.S. Consumer loan portfolio as of
December 31, 2010 (note that commercial market loans are not included
since they are business based and FICO scores are not a primary driver in
their credit evaluation). FICO scores are updated monthly for substantially
all of the portfolio or, otherwise, on a quarterly basis.
FICO Score Distribution in
U.S. Portfolio (1)(2) December 31, 2010
In millions of dollars FICO
Less than
620
≥ 620 but less
than 660
Equal to or
greater
than 660
First mortgages $ 24,794 $ 9,095 $ 50,589
Home equity loans 7,531 3,413 33,363
Credit cards 18,341 12,592 88,332
Installment and other 11,320 3,760 10,743
Total $ 61,986 $ 28,860 $ 183,027
(1) Excludes loans guaranteed by U.S. government agencies, loans subject to LTSCs, and loans recorded
at fair value.
(2) Excludes balances where FICO was not available. Such amounts are not material.