Citibank 2010 Annual Report Download - page 235
Download and view the complete annual report
Please find page 235 of the 2010 Citibank annual report below. You can navigate through the pages in the report by either clicking on the pages listed below, or by using the keyword search tool below to find specific information within the annual report.-
 1
1 -
 2
2 -
 3
3 -
 4
4 -
 5
5 -
 6
6 -
 7
7 -
 8
8 -
 9
9 -
 10
10 -
 11
11 -
 12
12 -
 13
13 -
 14
14 -
 15
15 -
 16
16 -
 17
17 -
 18
18 -
 19
19 -
 20
20 -
 21
21 -
 22
22 -
 23
23 -
 24
24 -
 25
25 -
 26
26 -
 27
27 -
 28
28 -
 29
29 -
 30
30 -
 31
31 -
 32
32 -
 33
33 -
 34
34 -
 35
35 -
 36
36 -
 37
37 -
 38
38 -
 39
39 -
 40
40 -
 41
41 -
 42
42 -
 43
43 -
 44
44 -
 45
45 -
 46
46 -
 47
47 -
 48
48 -
 49
49 -
 50
50 -
 51
51 -
 52
52 -
 53
53 -
 54
54 -
 55
55 -
 56
56 -
 57
57 -
 58
58 -
 59
59 -
 60
60 -
 61
61 -
 62
62 -
 63
63 -
 64
64 -
 65
65 -
 66
66 -
 67
67 -
 68
68 -
 69
69 -
 70
70 -
 71
71 -
 72
72 -
 73
73 -
 74
74 -
 75
75 -
 76
76 -
 77
77 -
 78
78 -
 79
79 -
 80
80 -
 81
81 -
 82
82 -
 83
83 -
 84
84 -
 85
85 -
 86
86 -
 87
87 -
 88
88 -
 89
89 -
 90
90 -
 91
91 -
 92
92 -
 93
93 -
 94
94 -
 95
95 -
 96
96 -
 97
97 -
 98
98 -
 99
99 -
 100
100 -
 101
101 -
 102
102 -
 103
103 -
 104
104 -
 105
105 -
 106
106 -
 107
107 -
 108
108 -
 109
109 -
 110
110 -
 111
111 -
 112
112 -
 113
113 -
 114
114 -
 115
115 -
 116
116 -
 117
117 -
 118
118 -
 119
119 -
 120
120 -
 121
121 -
 122
122 -
 123
123 -
 124
124 -
 125
125 -
 126
126 -
 127
127 -
 128
128 -
 129
129 -
 130
130 -
 131
131 -
 132
132 -
 133
133 -
 134
134 -
 135
135 -
 136
136 -
 137
137 -
 138
138 -
 139
139 -
 140
140 -
 141
141 -
 142
142 -
 143
143 -
 144
144 -
 145
145 -
 146
146 -
 147
147 -
 148
148 -
 149
149 -
 150
150 -
 151
151 -
 152
152 -
 153
153 -
 154
154 -
 155
155 -
 156
156 -
 157
157 -
 158
158 -
 159
159 -
 160
160 -
 161
161 -
 162
162 -
 163
163 -
 164
164 -
 165
165 -
 166
166 -
 167
167 -
 168
168 -
 169
169 -
 170
170 -
 171
171 -
 172
172 -
 173
173 -
 174
174 -
 175
175 -
 176
176 -
 177
177 -
 178
178 -
 179
179 -
 180
180 -
 181
181 -
 182
182 -
 183
183 -
 184
184 -
 185
185 -
 186
186 -
 187
187 -
 188
188 -
 189
189 -
 190
190 -
 191
191 -
 192
192 -
 193
193 -
 194
194 -
 195
195 -
 196
196 -
 197
197 -
 198
198 -
 199
199 -
 200
200 -
 201
201 -
 202
202 -
 203
203 -
 204
204 -
 205
205 -
 206
206 -
 207
207 -
 208
208 -
 209
209 -
 210
210 -
 211
211 -
 212
212 -
 213
213 -
 214
214 -
 215
215 -
 216
216 -
 217
217 -
 218
218 -
 219
219 -
 220
220 -
 221
221 -
 222
222 -
 223
223 -
 224
224 -
 225
225 -
 226
226 -
 227
227 -
 228
228 -
 229
229 -
 230
230 -
 231
231 -
 232
232 -
 233
233 -
 234
234 -
 235
235 -
 236
236 -
 237
237 -
 238
238 -
 239
239 -
 240
240 -
 241
241 -
 242
242 -
 243
243 -
 244
244 -
 245
245 -
 246
246 -
 247
247 -
 248
248 -
 249
249 -
 250
250 -
 251
251 -
 252
252 -
 253
253 -
 254
254 -
 255
255 -
 256
256 -
 257
257 -
 258
258 -
 259
259 -
 260
260 -
 261
261 -
 262
262 -
 263
263 -
 264
264 -
 265
265 -
 266
266 -
 267
267 -
 268
268 -
 269
269 -
 270
270 -
 271
271 -
 272
272 -
 273
273 -
 274
274 -
 275
275 -
 276
276 -
 277
277 -
 278
278 -
 279
279 -
 280
280 -
 281
281 -
 282
282 -
 283
283 -
 284
284 -
 285
285 -
 286
286 -
 287
287 -
 288
288 -
 289
289 -
 290
290 -
 291
291 -
 292
292 -
 293
293 -
 294
294 -
 295
295 -
 296
296 -
 297
297 -
 298
298 -
 299
299 -
 300
300 -
 301
301 -
 302
302 -
 303
303 -
 304
304 -
 305
305 -
 306
306 -
 307
307 -
 308
308 -
 309
309 -
 310
310 -
 311
311 -
 312
312
 |
 |

233
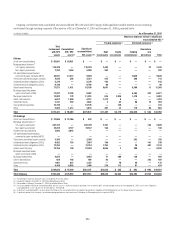
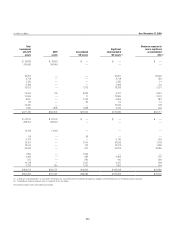
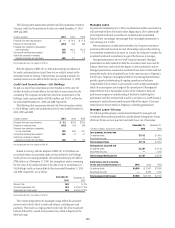
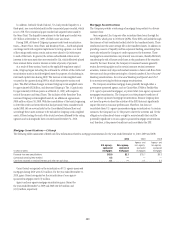
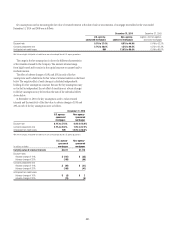
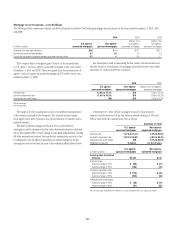
In millions of dollars As of December 31, 2009
Total
involvement
with SPE
assets
QSPE
assets
Consolidated
VIE assets
Significant
unconsolidated
VIE assets (1)
Maximum exposure to
loss in significant
unconsolidated
VIEs (2)
Credit card securitizations $ 78,833 $ 78,833 $ — $ — $ —
Mortgage securitizations (6) 264,949 264,949 — — —
U.S. agency-sponsored
Non-agency-sponsored
Citi-administered asset-backed
commercial paper conduits (ABCP) 36,327 — — 36,327 36,326
Third-party commercial paper conduits 3,718 — — 3,718 353
Collateralized debt obligations (CDOs) 2,785 — — 2,785 21
Collateralized loan obligations (CLOs) 5,409 — — 5,409 120
Asset-based financing 19,612 — 1,279 18,333 5,221
Municipal securities tender
option bond trusts (TOBs) 19,455 705 9,623 9,127 6,841
Municipal investments 10,906 — 11 10,895 2,370
Client intermediation 8,607 — 2,749 5,858 881
Investment funds 93 — 39 54 10
Trust preferred securities 19,345 — — 19,345 128
Other 7,380 1,808 1,838 3,734 446
$477,419 $346,295 $ 15,539 $ 115,585 $ 52,717
Credit card securitizations $ 42,274 $ 42,274 $ — $ — $ —
Mortgage securitizations (6) 308,504 308,504 — — —
U.S. agency-sponsored
Non-agency-sponsored
Student loan securitizations 14,343 14,343 — — —
Citi-administered asset-backed
commercial paper conduits (ABCP) 98 — 98 — —
Third-party commercial paper conduits 5,776 — — 5,776 439
Collateralized debt obligations (CDOs) 24,157 — 7,614 16,543 1,158
Collateralized loan obligations (CLOs) 13,515 — 142 13,373 1,658
Asset-based financing 52,598 — 370 52,228 18,385
Municipal securities tender
option bond trusts (TOBs) 1,999 — 1,999 — —
Municipal investments 5,364 — 882 4,482 375
Client intermediation 675 — 230 445 396
Investment funds 10,178 — 1,037 9,141 268
Other 3,732 610 1,472 1,650 604
$483,213 $365,731 $ 13,844 $ 103,638 $ 23,283
$960,632 $712,026 $ 29,383 $ 219,223 $ 76,000
(1) The definition of maximum exposure to loss is included in the text that follows.
(2) Included in Citigroup’s December 31, 2010 Consolidated Balance Sheet.
(3) Not included in Citigroup’s December 31, 2010 Consolidated Balance Sheet.
(4) Due to the adoption of ASC 810, (SFAS 167) on January 1, 2010, the previously disclosed assets of former QSPEs are now included in either the “Consolidated VIE / SPE assets” or the “Significant
unconsolidated VIE assets” columns for the December 31, 2010 period.
(5) A significant unconsolidated VIE is an entity where the Company has any variable interest considered to be significant, regardless of the likelihood of loss or the notional amount of exposure.
(6) A significant portion of the Company’s securitized mortgage portfolio was transferred from Citi Holdings to Citicorp during the first quarter of 2010.
(1) A significant unconsolidated VIE is an entity where the Company has any variable interest considered to be significant, regardless of the likelihood of loss or the notional amount of exposure.
(2) The definition of maximum exposure to loss is included in the text that follows.
Reclassified to conform to the current period’s presentation.
