Citibank 2010 Annual Report Download - page 293
Download and view the complete annual report
Please find page 293 of the 2010 Citibank annual report below. You can navigate through the pages in the report by either clicking on the pages listed below, or by using the keyword search tool below to find specific information within the annual report.-
 1
1 -
2
-
3
-
4
-
5
-
6
-
7
-
8
-
9
-
10
-
11
-
12
-
13
-
14
-
15
-
16
-
17
-
18
-
19
-
20
-
21
-
22
-
23
-
24
-
25
-
26
-
27
-
28
-
29
-
30
-
31
-
32
-
33
-
34
-
35
-
36
-
37
-
38
-
39
-
40
-
41
-
42
-
43
-
44
-
45
-
46
-
47
-
48
-
49
-
50
-
51
-
52
-
53
-
54
-
55
-
56
-
57
-
58
-
59
-
60
-
61
-
62
-
63
-
64
-
65
-
66
-
67
-
68
-
69
-
70
-
71
-
72
-
73
-
74
-
75
-
76
-
77
-
78
-
79
-
80
-
81
-
82
-
83
-
84
-
85
-
86
-
87
-
88
-
89
-
90
-
91
-
92
-
93
-
94
-
95
-
96
-
97
-
98
-
99
-
100
-
101
-
102
-
103
-
104
-
105
-
106
-
107
-
108
-
109
-
110
-
111
-
112
-
113
-
114
-
115
-
116
-
117
-
118
-
119
-
120
-
121
-
122
-
123
-
124
-
125
-
126
-
127
-
128
-
129
-
130
-
131
-
132
-
133
-
134
-
135
-
136
-
137
-
138
-
139
-
140
-
141
-
142
-
143
-
144
-
145
-
146
-
147
-
148
-
149
-
150
-
151
-
152
-
153
-
154
-
155
-
156
-
157
-
158
-
159
-
160
-
161
-
162
-
163
-
164
-
165
-
166
-
167
-
168
-
169
-
170
-
171
-
172
-
173
-
174
-
175
-
176
-
177
-
178
-
179
-
180
-
181
-
182
-
183
-
184
-
185
-
186
-
187
-
188
-
189
-
190
-
191
-
192
-
193
-
194
-
195
-
196
-
197
-
198
-
199
-
200
-
201
-
202
-
203
-
204
-
205
-
206
-
207
-
208
-
209
-
210
-
211
-
212
-
213
-
214
-
215
-
216
-
217
-
218
-
219
-
220
-
221
-
222
-
223
-
224
-
225
-
226
-
227
-
228
-
229
-
230
-
231
-
232
-
233
-
234
-
235
-
236
-
237
-
238
-
239
-
240
-
241
-
242
-
243
-
244
-
245
-
246
-
247
-
248
-
249
-
250
-
251
-
252
-
253
-
254
-
255
-
256
-
257
-
258
-
259
-
260
-
261
-
262
-
263
-
264
-
265
-
266
-
267
-
268
-
269
-
270
-
271
-
272
-
273
-
274
-
275
-
276
-
277
-
278
-
279
-
280
-
281
-
282
-
 283
283 -
 284
284 -
 285
285 -
 286
286 -
 287
287 -
 288
288 -
 289
289 -
 290
290 -
 291
291 -
 292
292 -
 293
293 -
 294
294 -
 295
295 -
 296
296 -
 297
297 -
 298
298 -
 299
299 -
 300
300 -
 301
301 -
 302
302 -
 303
303 -
304
-
305
-
306
-
307
-
308
-
309
-
310
-
311
-
312
 |
 |

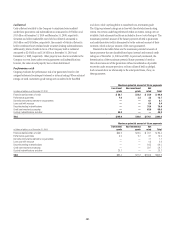
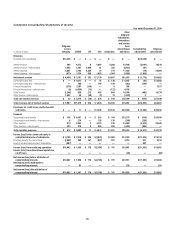
291
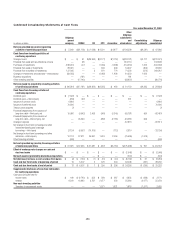
Condensed Consolidating Statements of Income
Year ended December 31, 2010
In millions of dollars
Citigroup
parent
company CGMHI CFI CCC Associates
Other
Citigroup
subsidiaries,
eliminations
and income
from
discontinued
operations
Consolidating
adjustments
Citigroup
consolidated
Revenues
Dividends from subsidiaries $14,448 $ — $ — $ — $ — $ — $(14,448) $ —
Interest revenue 269 6,213 8 5,097 5,860 67,166 (5,097) 79,516
Interest revenue—intercompany 2,968 2,167 2,990 81 385 (8,510) (81) —
Interest expense 8,601 2,145 2,356 79 274 11,488 (79) 24,864
Interest expense—intercompany (873) 3,134 260 1,929 1,364 (3,885) (1,929) —
Net interest revenue $ (4,491) $ 3,101 $ 382 $ 3,170 $4,607 $51,053 $ (3,170) $54,652
Commissions and fees $ — $ 4,677 $ — $ 45 $ 136 $ 8,845 $ (45) $13,658
Commissions and fees—intercompany — 108 — 140 159 (267) (140) —
Principal transactions (270) 7,207 (136) — 8 708 — 7,517
Principal transactions—intercompany (6) (4,056) (12) — (122) 4,196 — —
Other income (1,246) 838 212 493 664 10,306 (493) 10,774
Other income—intercompany 1,552 44 (90) (2) 73 (1,579) 2 —
Total non-interest revenues $ 30 $ 8,818 $ (26) $ 676 $ 918 $22,209 $ (676) $31,949
Total revenues, net of interest expense $ 9,987 $11,919 $ 356 $ 3,846 $5,525 $73,262 $(18,294) $86,601
Provisions for credit losses and for benefits
and claims $ — $ 17 $ — $ 2,306 $2,516 $23,509 $ (2,306) $26,042
Expenses
Compensation and benefits $ 136 $ 5,457 $ — $ 518 $ 704 $18,133 $ (518) $24,430
Compensation and benefits—intercompany 6 214 — 126 126 (346) (126) —
Other expense 413 2,943 2 3,374 518 19,069 (3,374) 22,945
Other expense—intercompany 323 478 9 555 593 (1,403) (555) —
Total operating expenses $ 878 $ 9,092 $ 11 $ 4,573 $1,941 $35,453 $ (4,573) $47,375
Income (loss) before taxes and equity in
undistributed income of subsidiaries $ 9,109 $ 2,810 $ 345 $(3,033) $1,068 $14,300 $(11,415) $13,184
Provision (benefit) for income taxes (2,480) 860 167 (927) 367 3,319 927 2,233
Equity in undistributed income of subsidiaries (987) — — — — — 987 —
Income (loss) from continuing operations $10,602 $ 1,950 $ 178 $(2,106) $ 701 $10,981 $(11,355) $10,951
Income (loss) from discontinued operations,
net of taxes — — — — — (68) — (68)
Net income (loss) before attribution of
noncontrolling interests $10,602 $ 1,950 $ 178 $(2,106) $ 701 $10,913 $(11,355) $10,883
Net income (loss) attributable to
noncontrolling interests — 53 — — — 228 — 281
Net income (loss) after attribution of
noncontrolling interests $10,602 $ 1,897 $ 178 $(2,106) $ 701 $10,685 $(11,355) $10,602