Citibank 2010 Annual Report Download - page 62
Download and view the complete annual report
Please find page 62 of the 2010 Citibank annual report below. You can navigate through the pages in the report by either clicking on the pages listed below, or by using the keyword search tool below to find specific information within the annual report.-
 1
1 -
2
-
3
-
4
-
5
-
6
-
7
-
8
-
9
-
10
-
11
-
12
-
13
-
14
-
15
-
16
-
17
-
18
-
19
-
20
-
21
-
22
-
23
-
24
-
25
-
26
-
27
-
28
-
29
-
30
-
31
-
32
-
33
-
34
-
35
-
36
-
37
-
38
-
39
-
40
-
41
-
42
-
43
-
44
-
45
-
46
-
47
-
48
-
49
-
50
-
51
-
 52
52 -
 53
53 -
 54
54 -
 55
55 -
 56
56 -
 57
57 -
 58
58 -
 59
59 -
 60
60 -
 61
61 -
 62
62 -
 63
63 -
 64
64 -
 65
65 -
 66
66 -
 67
67 -
 68
68 -
 69
69 -
 70
70 -
 71
71 -
 72
72 -
73
-
74
-
75
-
76
-
77
-
78
-
79
-
80
-
81
-
82
-
83
-
84
-
85
-
86
-
87
-
88
-
89
-
90
-
91
-
92
-
93
-
94
-
95
-
96
-
97
-
98
-
99
-
100
-
101
-
102
-
103
-
104
-
105
-
106
-
107
-
108
-
109
-
110
-
111
-
112
-
113
-
114
-
115
-
116
-
117
-
118
-
119
-
120
-
121
-
122
-
123
-
124
-
125
-
126
-
127
-
128
-
129
-
130
-
131
-
132
-
133
-
134
-
135
-
136
-
137
-
138
-
139
-
140
-
141
-
142
-
143
-
144
-
145
-
146
-
147
-
148
-
149
-
150
-
151
-
152
-
153
-
154
-
155
-
156
-
157
-
158
-
159
-
160
-
161
-
162
-
163
-
164
-
165
-
166
-
167
-
168
-
169
-
170
-
171
-
172
-
173
-
174
-
175
-
176
-
177
-
178
-
179
-
180
-
181
-
182
-
183
-
184
-
185
-
186
-
187
-
188
-
189
-
190
-
191
-
192
-
193
-
194
-
195
-
196
-
197
-
198
-
199
-
200
-
201
-
202
-
203
-
204
-
205
-
206
-
207
-
208
-
209
-
210
-
211
-
212
-
213
-
214
-
215
-
216
-
217
-
218
-
219
-
220
-
221
-
222
-
223
-
224
-
225
-
226
-
227
-
228
-
229
-
230
-
231
-
232
-
233
-
234
-
235
-
236
-
237
-
238
-
239
-
240
-
241
-
242
-
243
-
244
-
245
-
246
-
247
-
248
-
249
-
250
-
251
-
252
-
253
-
254
-
255
-
256
-
257
-
258
-
259
-
260
-
261
-
262
-
263
-
264
-
265
-
266
-
267
-
268
-
269
-
270
-
271
-
272
-
273
-
274
-
275
-
276
-
277
-
278
-
279
-
280
-
281
-
282
-
283
-
284
-
285
-
286
-
287
-
288
-
289
-
290
-
291
-
292
-
293
-
294
-
295
-
296
-
297
-
298
-
299
-
300
-
301
-
302
-
303
-
304
-
305
-
306
-
307
-
308
-
309
-
310
-
311
-
312
 |
 |

60
Adoption of SFAS 166/167 Impact on Capital
As previously disclosed and as described further in Note 1 to the Consolidated
Financial Statements, the adoption of SFAS 166/167 resulted in the
consolidation of $137 billion of incremental assets and $146 billion of
liabilities, including securitized credit card receivables, onto Citigroup’s
Consolidated Balance Sheet on the date of adoption, as of January 1, 2010.
The adoption of SFAS 166/167 also resulted in a net increase of $10 billion
in risk-weighted assets. In addition, Citi added $13.4 billion to the loan
loss allowance, increased deferred tax assets by $5.0 billion, and reduced
retained earnings by $8.4 billion. This translated into a decrease in Tier 1
Common, Tier 1 Capital and Total Capital of $14.2 billion, $14.2 billion
and $14.0 billion, respectively, and a reduction in Tangible Common Equity
(described below) of $8.4 billion.
The impact on Citigroup’s capital ratios from the January 1, 2010
adoption of SFAS 166/167 was as follows:
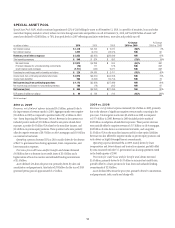
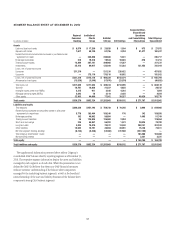
As of January 1, 2010 Impact
Tier 1 Common (138) bps
Tier 1 Capital (141) bps
Total Capital (142) bps
Leverage ratio (118) bps
Tangible Common Equity (TCE)/RWA (87) bps
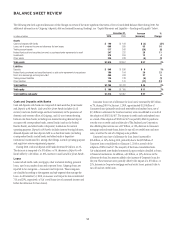
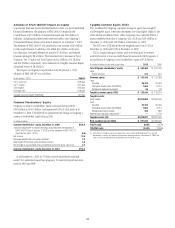
Common Stockholders’ Equity
Citigroup’s common stockholders’ equity increased during 2010 by
$10.8 billion to $163.2 billion, and represented 8.5% of total assets as of
December 31, 2010. The table below summarizes the change in Citigroup’s
common stockholders’ equity during 2010:
In billions of dollars
Common stockholders’ equity, December 31, 2009 $152.4
Transition adjustment to retained earnings associated with the adoption of
SFAS 166/167 (as of January 1, 2010) and the adoption of ASU 2010-11
(recorded on July 1, 2010) (8.5)
Net income 10.6
Employee benefit plans and other activities 2.2
ADIA Upper DECs equity units purchase contract 3.8
Net change in accumulated other comprehensive income (loss), net of tax 2.7
Common stockholders’ equity, December 31, 2010 $163.2
As of December 31, 2010, $6.7 billion of stock repurchases remained
under Citi’s authorized repurchase programs. No material repurchases were
made in 2010 and 2009.
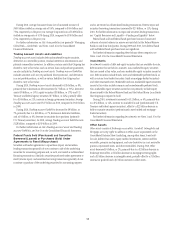
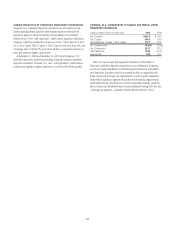
Tangible Common Equity (TCE)
TCE, as defined by Citigroup, represents Common equity less Goodwill
and Intangible assets (other than Mortgage Servicing Rights (MSRs)), net
of the related net deferred taxes. Other companies may calculate TCE in a
manner different from that of Citigroup. Citi’s TCE was $129.4 billion at
December 31, 2010 and $118.2 billion at December 31, 2009.
The TCE ratio (TCE divided by risk-weighted assets) was 13.2% at
December 31, 2010 and 10.9% at December 31, 2009.
TCE is a capital adequacy metric used and relied upon by industry
analysts; however, it is a non-GAAP financial measure for SEC purposes. A
reconciliation of Citigroup’s total stockholders’ equity to TCE follows:
In millions of dollars at year end, except ratios 2010 2009
Total Citigroup stockholders’ equity $ 163,468 $ 152,700
Less:
Preferred stock 312 312
Common equity $ 163,156 $ 152,388
Less:
Goodwill 26,152 25,392
Intangible assets (other than MSRs) 7,504 8,714
Related net deferred tax assets 56 68
Tangible common equity (TCE) $ 129,444 $ 118,214
Tangible assets
GAAP assets $1,913,902 $1,856,646
Less:
Goodwill 26,152 25,392
Intangible assets (other than MSRs) 7,504 8,714
Related deferred tax assets 359 386
Federal bank regulatory adjustment (1) —5,746
Tangible assets (TA) $1,879,887 $1,827,900
Risk-weighted assets (RWA) $ 977,629 $1,088,526
TCE/TA ratio 6.89% 6.47%
TCE/RWA ratio 13.24% 10.86%
(1) Adjustment to recognize repurchase agreements and securities lending agreements as secured
borrowing transactions for Federal bank regulatory reporting purposes at December 31, 2009. See
Note 1 to the Consolidated Financial Statements for further discussion.