Citibank 2010 Annual Report Download - page 265
Download and view the complete annual report
Please find page 265 of the 2010 Citibank annual report below. You can navigate through the pages in the report by either clicking on the pages listed below, or by using the keyword search tool below to find specific information within the annual report.-
 1
1 -
2
-
3
-
4
-
5
-
6
-
7
-
8
-
9
-
10
-
11
-
12
-
13
-
14
-
15
-
16
-
17
-
18
-
19
-
20
-
21
-
22
-
23
-
24
-
25
-
26
-
27
-
28
-
29
-
30
-
31
-
32
-
33
-
34
-
35
-
36
-
37
-
38
-
39
-
40
-
41
-
42
-
43
-
44
-
45
-
46
-
47
-
48
-
49
-
50
-
51
-
52
-
53
-
54
-
55
-
56
-
57
-
58
-
59
-
60
-
61
-
62
-
63
-
64
-
65
-
66
-
67
-
68
-
69
-
70
-
71
-
72
-
73
-
74
-
75
-
76
-
77
-
78
-
79
-
80
-
81
-
82
-
83
-
84
-
85
-
86
-
87
-
88
-
89
-
90
-
91
-
92
-
93
-
94
-
95
-
96
-
97
-
98
-
99
-
100
-
101
-
102
-
103
-
104
-
105
-
106
-
107
-
108
-
109
-
110
-
111
-
112
-
113
-
114
-
115
-
116
-
117
-
118
-
119
-
120
-
121
-
122
-
123
-
124
-
125
-
126
-
127
-
128
-
129
-
130
-
131
-
132
-
133
-
134
-
135
-
136
-
137
-
138
-
139
-
140
-
141
-
142
-
143
-
144
-
145
-
146
-
147
-
148
-
149
-
150
-
151
-
152
-
153
-
154
-
155
-
156
-
157
-
158
-
159
-
160
-
161
-
162
-
163
-
164
-
165
-
166
-
167
-
168
-
169
-
170
-
171
-
172
-
173
-
174
-
175
-
176
-
177
-
178
-
179
-
180
-
181
-
182
-
183
-
184
-
185
-
186
-
187
-
188
-
189
-
190
-
191
-
192
-
193
-
194
-
195
-
196
-
197
-
198
-
199
-
200
-
201
-
202
-
203
-
204
-
205
-
206
-
207
-
208
-
209
-
210
-
211
-
212
-
213
-
214
-
215
-
216
-
217
-
218
-
219
-
220
-
221
-
222
-
223
-
224
-
225
-
226
-
227
-
228
-
229
-
230
-
231
-
232
-
233
-
234
-
235
-
236
-
237
-
238
-
239
-
240
-
241
-
242
-
243
-
244
-
245
-
246
-
247
-
248
-
249
-
250
-
251
-
252
-
253
-
254
-
 255
255 -
 256
256 -
 257
257 -
 258
258 -
 259
259 -
 260
260 -
 261
261 -
 262
262 -
 263
263 -
 264
264 -
 265
265 -
 266
266 -
 267
267 -
 268
268 -
 269
269 -
 270
270 -
 271
271 -
 272
272 -
 273
273 -
 274
274 -
 275
275 -
276
-
277
-
278
-
279
-
280
-
281
-
282
-
283
-
284
-
285
-
286
-
287
-
288
-
289
-
290
-
291
-
292
-
293
-
294
-
295
-
296
-
297
-
298
-
299
-
300
-
301
-
302
-
303
-
304
-
305
-
306
-
307
-
308
-
309
-
310
-
311
-
312
 |
 |
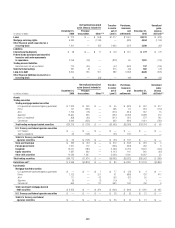
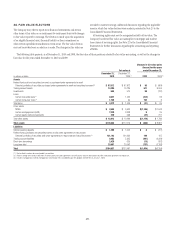
263
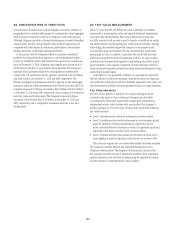
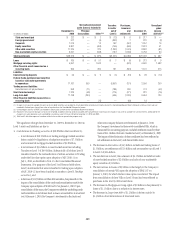
The internal valuation techniques used for Alt-A mortgage securities, as
with other mortgage exposures, consider estimated housing price changes,
unemployment rates, interest rates and borrower attributes. They also
consider prepayment rates as well as other market indicators.
Alt-A mortgage securities that are valued using these methods are
generally classified as Level 2. However, Alt-A mortgage securities backed by
Alt-A mortgages of lower quality or more recent vintages are mostly classified
as Level 3 due to the reduced liquidity that exists for such positions, which
reduces the reliability of prices available from independent sources.
Commercial real estate exposure
Citigroup reports a number of different exposures linked to commercial real
estate at fair value with changes in fair value reported in earnings, including
securities, loans and investments in entities that hold commercial real estate
loans or commercial real estate directly. The Company also reports securities
backed by commercial real estate as available-for-sale investments, which are
carried at fair value with changes in fair-value reported in AOCI.
Similar to the valuation methodologies used for other trading securities
and trading loans, the Company generally determines the fair value of
securities and loans linked to commercial real estate utilizing internal
valuation techniques. Fair-value estimates from internal valuation
techniques are verified, where possible, to prices obtained from independent
vendors. Vendors compile prices from various sources. Where available, the
Company may also make use of quoted prices for recent trading activity
in securities or loans with the same or similar characteristics to that being
valued. Securities and loans linked to commercial real estate valued using
these methodologies are generally classified as Level 3 as a result of the
current reduced liquidity in the market for such exposures.
The fair value of investments in entities that hold commercial real
estate loans or commercial real estate directly is determined using a similar
methodology to that used for other non-public investments in real estate
held by the S&B business. The Company uses an established process for
determining the fair value of such securities, using commonly accepted
valuation techniques, including the use of earnings multiples based on
comparable public securities, industry-specific non-earnings-based multiples
and discounted cash flow models. In determining the fair value of such
investments, the Company also considers events, such as a proposed sale
of the investee company, initial public offerings, equity issuances, or other
observable transactions. Such investments are generally classified as Level 3
of the fair value hierarchy.