Citibank 2010 Annual Report Download - page 105
Download and view the complete annual report
Please find page 105 of the 2010 Citibank annual report below. You can navigate through the pages in the report by either clicking on the pages listed below, or by using the keyword search tool below to find specific information within the annual report.-
 1
1 -
2
-
3
-
4
-
5
-
6
-
7
-
8
-
9
-
10
-
11
-
12
-
13
-
14
-
15
-
16
-
17
-
18
-
19
-
20
-
21
-
22
-
23
-
24
-
25
-
26
-
27
-
28
-
29
-
30
-
31
-
32
-
33
-
34
-
35
-
36
-
37
-
38
-
39
-
40
-
41
-
42
-
43
-
44
-
45
-
46
-
47
-
48
-
49
-
50
-
51
-
52
-
53
-
54
-
55
-
56
-
57
-
58
-
59
-
60
-
61
-
62
-
63
-
64
-
65
-
66
-
67
-
68
-
69
-
70
-
71
-
72
-
73
-
74
-
75
-
76
-
77
-
78
-
79
-
80
-
81
-
82
-
83
-
84
-
85
-
86
-
87
-
88
-
89
-
90
-
91
-
92
-
93
-
94
-
 95
95 -
 96
96 -
 97
97 -
 98
98 -
 99
99 -
 100
100 -
 101
101 -
 102
102 -
 103
103 -
 104
104 -
 105
105 -
 106
106 -
 107
107 -
 108
108 -
 109
109 -
 110
110 -
 111
111 -
 112
112 -
 113
113 -
 114
114 -
 115
115 -
116
-
117
-
118
-
119
-
120
-
121
-
122
-
123
-
124
-
125
-
126
-
127
-
128
-
129
-
130
-
131
-
132
-
133
-
134
-
135
-
136
-
137
-
138
-
139
-
140
-
141
-
142
-
143
-
144
-
145
-
146
-
147
-
148
-
149
-
150
-
151
-
152
-
153
-
154
-
155
-
156
-
157
-
158
-
159
-
160
-
161
-
162
-
163
-
164
-
165
-
166
-
167
-
168
-
169
-
170
-
171
-
172
-
173
-
174
-
175
-
176
-
177
-
178
-
179
-
180
-
181
-
182
-
183
-
184
-
185
-
186
-
187
-
188
-
189
-
190
-
191
-
192
-
193
-
194
-
195
-
196
-
197
-
198
-
199
-
200
-
201
-
202
-
203
-
204
-
205
-
206
-
207
-
208
-
209
-
210
-
211
-
212
-
213
-
214
-
215
-
216
-
217
-
218
-
219
-
220
-
221
-
222
-
223
-
224
-
225
-
226
-
227
-
228
-
229
-
230
-
231
-
232
-
233
-
234
-
235
-
236
-
237
-
238
-
239
-
240
-
241
-
242
-
243
-
244
-
245
-
246
-
247
-
248
-
249
-
250
-
251
-
252
-
253
-
254
-
255
-
256
-
257
-
258
-
259
-
260
-
261
-
262
-
263
-
264
-
265
-
266
-
267
-
268
-
269
-
270
-
271
-
272
-
273
-
274
-
275
-
276
-
277
-
278
-
279
-
280
-
281
-
282
-
283
-
284
-
285
-
286
-
287
-
288
-
289
-
290
-
291
-
292
-
293
-
294
-
295
-
296
-
297
-
298
-
299
-
300
-
301
-
302
-
303
-
304
-
305
-
306
-
307
-
308
-
309
-
310
-
311
-
312
 |
 |

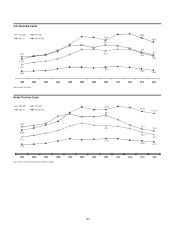
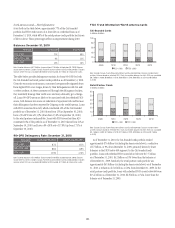
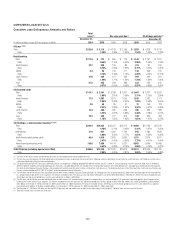
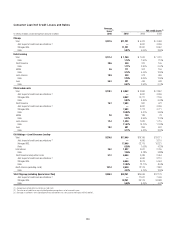
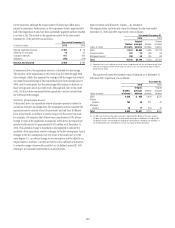
103
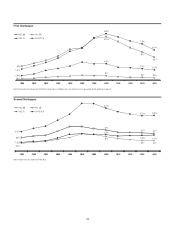
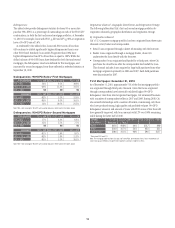
CONSUMER LOAN DETAILS
Consumer Loan Delinquency Amounts and Ratios
Total
loans (7) 90+ days past due (1) 30–89 days past due (1)
December 31, December 31,
In millions of dollars, except EOP loan amounts in billions 2010 2010 2009 2008 2010 2009 2008
Citicorp (2)(3)(4)
Total $232.0 $ 3,114 $ 4,103 $ 3,596 $ 3,555 $ 4,338 $ 4,713
Ratio 1.35% 1.83% 1.62% 1.54% 1.93% 2.13%
Retail banking
Total $117.9 $ 773 $ 805 $ 719 $ 1,148 $ 1,107 $ 1,391
Ratio 0.66% 0.75% 0.69% 0.98% 1.03% 1.33%
North America 30.7 228 106 83 212 81 100
Ratio 0.76% 0.33% 0.25% 0.71% 0.25% 0.30%
EMEA 4.4 96 129 111 136 223 215
Ratio 2.18% 2.48% 1.76% 3.09% 4.29% 3.41%
Latin America 21.6 224 311 239 267 344 261
Ratio 1.04% 1.71% 1.52% 1.24% 1.89% 1.66%
Asia 61.2 225 259 286 533 459 815
Ratio 0.37% 0.50% 0.58% 0.87% 0.89% 1.66%
Citi-branded cards
Total $114.1 $ 2,341 $ 3,298 $ 2,877 $ 2,407 $ 3,231 $ 3,322
Ratio 2.05% 2.81% 2.46% 2.11% 2.75% 2.84%
North America 77.5 1,597 2,371 2,000 1,539 2,182 2,171
Ratio 2.06% 2.82% 2.35% 1.99% 2.59% 2.55%
EMEA 2.8 58 85 37 72 140 123
Ratio 2.07% 2.83% 1.32% 2.57% 4.67% 4.39%
Latin America 13.4 446 565 566 456 556 638
Ratio 3.33% 4.56% 4.68% 3.40% 4.48% 5.27%
Asia 20.4 240 277 274 340 353 390
Ratio 1.18% 1.55% 1.63% 1.67% 1.97% 2.32%
Citi Holdings—Local Consumer Lending (2)(3)(5)(6)
Total $224.9 $10,225 $18,457 $13,017 $ 9,462 $14,105 $15,412
Ratio 4.76% 6.11% 3.65% 4.41% 4.67% 4.32%
International 21.9 657 1,362 1,166 848 1,482 1,846
Ratio 3.00% 4.22% 2.77% 3.87% 4.59% 4.38%
North America retail partner cards 46.4 1,610 2,681 2,630 1,751 2,674 3,077
Ratio 3.47% 4.42% 3.80% 3.77% 4.41% 4.44%
North America (excluding cards) 156.6 7,958 14,414 9,221 6,863 9,949 10,489
Ratio 5.43% 6.89% 3.76% 4.68% 4.76% 4.27%
Total Citigroup (excluding Special Asset Pool) $456.9 $13,339 $22,560 $16,613 $13,017 $18,443 $20,125
Ratio 2.99% 4.29% 2.87% 2.92% 3.50% 3.48%
(1) The ratios of 90+ days past due and 30–89 days past due are calculated based on end-of-period (EOP) loans.
(2) The 90+ days past due balances for Citi-branded cards and retail partner cards are generally still accruing interest. Citigroup’s policy is generally to accrue interest on credit card loans until 180 days past due, unless
notification of bankruptcy filing has been received earlier.
(3) The above information presents Consumer credit information on a managed basis. Citigroup adopted SFAS 166/167 effective January 1, 2010. As a result, beginning in the first quarter of 2010, there is no longer a
difference between reported and managed delinquencies. Prior years’ managed delinquencies are included herein for comparative purposes to the 2010 delinquencies. Managed basis reporting historically impacted
the North America Regional Consumer Banking—Citi-branded cards and the Local Consumer Lending—retail partner cards businesses. The historical disclosures reflect the impact from credit card securitizations only.
See discussion of adoption of SFAS 166/167 in Note 1 to the Consolidated Financial Statements.
(4) The 90+ days and 30–89 days past due and related ratios for North America Regional Consumer Banking exclude U.S. mortgage loans that are guaranteed by U.S. government sponsored agencies since the potential
loss predominantly resides within the U.S. agencies. The amounts excluded for loans 90+ days past due and (end-of-period loans) are $235 million ($0.8 billion) at December 31, 2010. The amount excluded for loans
30–89 days past due (end-of-period loans have the same adjustment as above) is $30 million.
(5) The 90+ days and 30–89 days past due and related ratios for North America LCL (excluding cards) exclude U.S. mortgage loans that are guaranteed by U.S. government sponsored agencies since the potential loss
predominantly resides within the U.S. agencies. The amounts excluded for loans 90+ days past due and (end-of-period loans) for each period are $5.2 billion ($8.4 billion), $5.4 billion ($9.0 billion), and $3.0 billion
($6.2 billion) at December 31, 2010, December 31, 2009, and December 31, 2008, respectively. The amounts excluded for loans 30–89 days past due (end-of-period loans have the same adjustment as above) for
each period are $1.6 billion, $1.0 billion, and $0.6 billion, as of December 31, 2010, December 31, 2009, and December 31, 2008, respectively.
(6) The December 31, 2010 loans 90+ days past due and 30–89 days past due and related ratios for North America (excluding Cards) exclude $1.7 billion of loans that are carried at fair value.
(7) Total loans include interest and fees on credit cards.