Citibank 2010 Annual Report Download - page 197
Download and view the complete annual report
Please find page 197 of the 2010 Citibank annual report below. You can navigate through the pages in the report by either clicking on the pages listed below, or by using the keyword search tool below to find specific information within the annual report.-
 1
1 -
2
-
3
-
4
-
5
-
6
-
7
-
8
-
9
-
10
-
11
-
12
-
13
-
14
-
15
-
16
-
17
-
18
-
19
-
20
-
21
-
22
-
23
-
24
-
25
-
26
-
27
-
28
-
29
-
30
-
31
-
32
-
33
-
34
-
35
-
36
-
37
-
38
-
39
-
40
-
41
-
42
-
43
-
44
-
45
-
46
-
47
-
48
-
49
-
50
-
51
-
52
-
53
-
54
-
55
-
56
-
57
-
58
-
59
-
60
-
61
-
62
-
63
-
64
-
65
-
66
-
67
-
68
-
69
-
70
-
71
-
72
-
73
-
74
-
75
-
76
-
77
-
78
-
79
-
80
-
81
-
82
-
83
-
84
-
85
-
86
-
87
-
88
-
89
-
90
-
91
-
92
-
93
-
94
-
95
-
96
-
97
-
98
-
99
-
100
-
101
-
102
-
103
-
104
-
105
-
106
-
107
-
108
-
109
-
110
-
111
-
112
-
113
-
114
-
115
-
116
-
117
-
118
-
119
-
120
-
121
-
122
-
123
-
124
-
125
-
126
-
127
-
128
-
129
-
130
-
131
-
132
-
133
-
134
-
135
-
136
-
137
-
138
-
139
-
140
-
141
-
142
-
143
-
144
-
145
-
146
-
147
-
148
-
149
-
150
-
151
-
152
-
153
-
154
-
155
-
156
-
157
-
158
-
159
-
160
-
161
-
162
-
163
-
164
-
165
-
166
-
167
-
168
-
169
-
170
-
171
-
172
-
173
-
174
-
175
-
176
-
177
-
178
-
179
-
180
-
181
-
182
-
183
-
184
-
185
-
186
-
 187
187 -
 188
188 -
 189
189 -
 190
190 -
 191
191 -
 192
192 -
 193
193 -
 194
194 -
 195
195 -
 196
196 -
 197
197 -
 198
198 -
 199
199 -
 200
200 -
 201
201 -
 202
202 -
 203
203 -
 204
204 -
 205
205 -
 206
206 -
 207
207 -
208
-
209
-
210
-
211
-
212
-
213
-
214
-
215
-
216
-
217
-
218
-
219
-
220
-
221
-
222
-
223
-
224
-
225
-
226
-
227
-
228
-
229
-
230
-
231
-
232
-
233
-
234
-
235
-
236
-
237
-
238
-
239
-
240
-
241
-
242
-
243
-
244
-
245
-
246
-
247
-
248
-
249
-
250
-
251
-
252
-
253
-
254
-
255
-
256
-
257
-
258
-
259
-
260
-
261
-
262
-
263
-
264
-
265
-
266
-
267
-
268
-
269
-
270
-
271
-
272
-
273
-
274
-
275
-
276
-
277
-
278
-
279
-
280
-
281
-
282
-
283
-
284
-
285
-
286
-
287
-
288
-
289
-
290
-
291
-
292
-
293
-
294
-
295
-
296
-
297
-
298
-
299
-
300
-
301
-
302
-
303
-
304
-
305
-
306
-
307
-
308
-
309
-
310
-
311
-
312
 |
 |

195
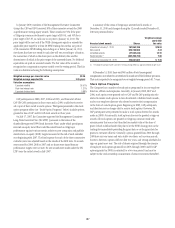
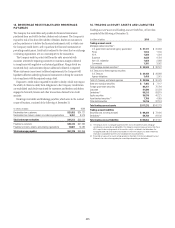
A one-percentage-point change in the expected rates of return would have the following effects on pension expense:
One-percentage-point increase One-percentage-point decrease
In millions of dollars 2010 2009 2008 2010 2009 2008
Effect on pension expense for U.S. plans $(119) $(109) $(118) $119 $109 $118
Effect on pension expense for non-U.S. plans (54) (44) (66) 54 44 66
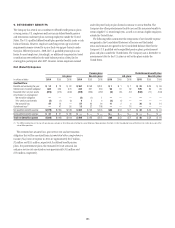
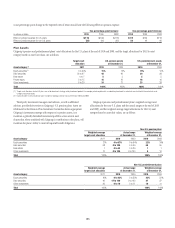
Plan Assets
Citigroup’s pension and postretirement plans’ asset allocations for the U.S. plans at the end of 2010 and 2009, and the target allocations for 2011 by asset
category based on asset fair values, are as follows:
Target asset
allocation
U.S. pension assets
at December 31,
U.S. postretirement assets
at December 31,
Asset category (1) 2011 2010 2009 2010 2009
Equity securities (2) 0 to 34% 15% 12% 15% 12%
Debt securities 30 to 67 40 40 39 39
Real estate 0 to 7 5555
Private equity 0 to 15 16 16 16 16
Other investments 8 to 29 24 27 25 28
Total 100% 100% 100% 100%
(1) Target asset allocations for the U.S. plans are set by investment strategy, not by investment product. For example, private equities with an underlying investment in real estate are classified in the real estate asset
category, not private equity.
(2) Equity securities in the U.S. pension plans include no Citigroup common stock at the end of 2010 and 2009.
Third-party investment managers and advisors, as well as affiliated
advisors, provide their services to Citigroup’s U.S. pension plans. Assets are
rebalanced as the Pension Plan Investment Committee deems appropriate.
Citigroup’s investment strategy, with respect to its pension assets, is to
maintain a globally diversified investment portfolio across several asset
classes that, when combined with Citigroup’s contributions to the plans, will
maintain the plans’ ability to meet all required benefit obligations.
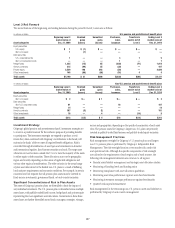
Citigroup’s pension and postretirement plans’ weighted-average asset
allocations for the non-U.S. plans and the actual ranges at the end of 2010
and 2009, and the weighted-average target allocations for 2011 by asset
category based on asset fair values, are as follows:
Non-U.S. pension plans
Weighted-average
target asset allocation
Actual range
at December 31,
Weighted-average
at December 31,
Asset category 2011 2010 2009 2010 2009
Equity securities 21% 0 to 67% 0 to 64% 22% 34%
Debt securities 68 0 to 100 0 to 99 68 55
Real estate 1 0 to 43 0 to 29 11
Other investments 10 0 to 100 0 to 100 910
Total 100% 100% 100%
Non-U.S. postretirement plans
Weighted-average
target asset allocation
Actual range
at December 31,
Weighted-average
at December 31,
Asset category 2011 2010 2009 2010 2009
Equity securities 40% 0 to 43% 0 to 53% 43% 52%
Debt securities 40 47 to 100 0 to 100 47 37
Other investments 20 0 to 10 0 to 11 10 11
Total 100% 100% 100%