Citibank 2010 Annual Report Download - page 122
Download and view the complete annual report
Please find page 122 of the 2010 Citibank annual report below. You can navigate through the pages in the report by either clicking on the pages listed below, or by using the keyword search tool below to find specific information within the annual report.-
 1
1 -
2
-
3
-
4
-
5
-
6
-
7
-
8
-
9
-
10
-
11
-
12
-
13
-
14
-
15
-
16
-
17
-
18
-
19
-
20
-
21
-
22
-
23
-
24
-
25
-
26
-
27
-
28
-
29
-
30
-
31
-
32
-
33
-
34
-
35
-
36
-
37
-
38
-
39
-
40
-
41
-
42
-
43
-
44
-
45
-
46
-
47
-
48
-
49
-
50
-
51
-
52
-
53
-
54
-
55
-
56
-
57
-
58
-
59
-
60
-
61
-
62
-
63
-
64
-
65
-
66
-
67
-
68
-
69
-
70
-
71
-
72
-
73
-
74
-
75
-
76
-
77
-
78
-
79
-
80
-
81
-
82
-
83
-
84
-
85
-
86
-
87
-
88
-
89
-
90
-
91
-
92
-
93
-
94
-
95
-
96
-
97
-
98
-
99
-
100
-
101
-
102
-
103
-
104
-
105
-
106
-
107
-
108
-
109
-
110
-
111
-
 112
112 -
 113
113 -
 114
114 -
 115
115 -
 116
116 -
 117
117 -
 118
118 -
 119
119 -
 120
120 -
 121
121 -
 122
122 -
 123
123 -
 124
124 -
 125
125 -
 126
126 -
 127
127 -
 128
128 -
 129
129 -
 130
130 -
 131
131 -
 132
132 -
133
-
134
-
135
-
136
-
137
-
138
-
139
-
140
-
141
-
142
-
143
-
144
-
145
-
146
-
147
-
148
-
149
-
150
-
151
-
152
-
153
-
154
-
155
-
156
-
157
-
158
-
159
-
160
-
161
-
162
-
163
-
164
-
165
-
166
-
167
-
168
-
169
-
170
-
171
-
172
-
173
-
174
-
175
-
176
-
177
-
178
-
179
-
180
-
181
-
182
-
183
-
184
-
185
-
186
-
187
-
188
-
189
-
190
-
191
-
192
-
193
-
194
-
195
-
196
-
197
-
198
-
199
-
200
-
201
-
202
-
203
-
204
-
205
-
206
-
207
-
208
-
209
-
210
-
211
-
212
-
213
-
214
-
215
-
216
-
217
-
218
-
219
-
220
-
221
-
222
-
223
-
224
-
225
-
226
-
227
-
228
-
229
-
230
-
231
-
232
-
233
-
234
-
235
-
236
-
237
-
238
-
239
-
240
-
241
-
242
-
243
-
244
-
245
-
246
-
247
-
248
-
249
-
250
-
251
-
252
-
253
-
254
-
255
-
256
-
257
-
258
-
259
-
260
-
261
-
262
-
263
-
264
-
265
-
266
-
267
-
268
-
269
-
270
-
271
-
272
-
273
-
274
-
275
-
276
-
277
-
278
-
279
-
280
-
281
-
282
-
283
-
284
-
285
-
286
-
287
-
288
-
289
-
290
-
291
-
292
-
293
-
294
-
295
-
296
-
297
-
298
-
299
-
300
-
301
-
302
-
303
-
304
-
305
-
306
-
307
-
308
-
309
-
310
-
311
-
312
 |
 |

120
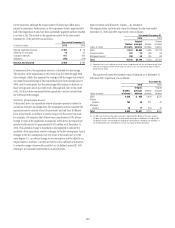
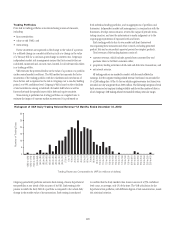
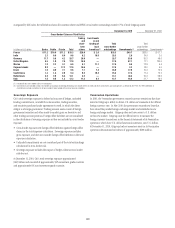
The level of price risk exposure at any given point in time depends on the
market environment and expectations of future price and market movements, and
will vary from period to period.
For Citigroup’s major trading centers, the aggregate pretax VAR in the
trading portfolios was $191 million at December 31, 2010 and $205 million at
December 31, 2009. Daily exposures averaged $205 million in 2010 and ranged
from $145 million to $289 million.
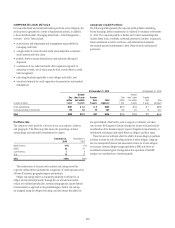
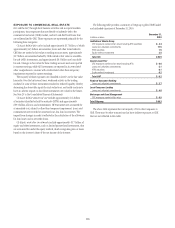
The following table summarizes VAR of Citigroup in the trading portfolios
as of December 31, 2010 and 2009, including the total VAR, the specific risk-
only component of VAR, and total—general market factors only, along with
the yearly averages:
In millions of dollars
Dec. 31,
2010
2010
Average
Dec. 31,
2009
2009
Average
Interest rate $ 235 $ 234 $ 191 $ 235
Foreign exchange 52 61 45 65
Equity 56 59 69 79
Commodity 19 23 18 34
Covariance adjustment (171) (172) (118) (147)
Total—all market
risk factors,
including general
and specific risk $ 191 $ 205 $ 205 $ 266
Specific risk-only
component $ 8 $ 18 $ 20 $ 20
Total—general
market factors only $ 183 $ 187 $ 185 $ 246
The specific risk-only component represents the level of equity and debt
issuer-specific risk embedded in VAR.
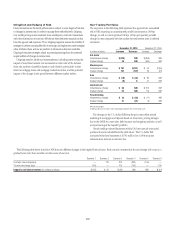
The table below provides the range of VAR in each type of trading portfolio
that was experienced during 2010 and 2009:
2010 2009
In millions of dollars Low High Low High
Interest rate $171 $315 $185 $320
Foreign exchange 31 98 18 140
Equity 31 111 46 167
Commodity 15 39 12 50
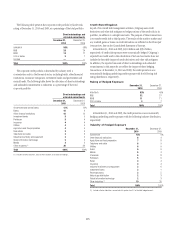
The following table provides the VAR for Citicorp’s Securities and Banking
business (ICG Citicorp VAR, which excludes Consumer) during 2010:
In millions of dollars Dec. 31, 2010
Total—all market risk
factors, including
general and specific risk $159
Average—during year $151
High—during year 235
Low—during year 99