Citibank 2010 Annual Report Download - page 61
Download and view the complete annual report
Please find page 61 of the 2010 Citibank annual report below. You can navigate through the pages in the report by either clicking on the pages listed below, or by using the keyword search tool below to find specific information within the annual report.-
 1
1 -
2
-
3
-
4
-
5
-
6
-
7
-
8
-
9
-
10
-
11
-
12
-
13
-
14
-
15
-
16
-
17
-
18
-
19
-
20
-
21
-
22
-
23
-
24
-
25
-
26
-
27
-
28
-
29
-
30
-
31
-
32
-
33
-
34
-
35
-
36
-
37
-
38
-
39
-
40
-
41
-
42
-
43
-
44
-
45
-
46
-
47
-
48
-
49
-
50
-
 51
51 -
 52
52 -
 53
53 -
 54
54 -
 55
55 -
 56
56 -
 57
57 -
 58
58 -
 59
59 -
 60
60 -
 61
61 -
 62
62 -
 63
63 -
 64
64 -
 65
65 -
 66
66 -
 67
67 -
 68
68 -
 69
69 -
 70
70 -
 71
71 -
72
-
73
-
74
-
75
-
76
-
77
-
78
-
79
-
80
-
81
-
82
-
83
-
84
-
85
-
86
-
87
-
88
-
89
-
90
-
91
-
92
-
93
-
94
-
95
-
96
-
97
-
98
-
99
-
100
-
101
-
102
-
103
-
104
-
105
-
106
-
107
-
108
-
109
-
110
-
111
-
112
-
113
-
114
-
115
-
116
-
117
-
118
-
119
-
120
-
121
-
122
-
123
-
124
-
125
-
126
-
127
-
128
-
129
-
130
-
131
-
132
-
133
-
134
-
135
-
136
-
137
-
138
-
139
-
140
-
141
-
142
-
143
-
144
-
145
-
146
-
147
-
148
-
149
-
150
-
151
-
152
-
153
-
154
-
155
-
156
-
157
-
158
-
159
-
160
-
161
-
162
-
163
-
164
-
165
-
166
-
167
-
168
-
169
-
170
-
171
-
172
-
173
-
174
-
175
-
176
-
177
-
178
-
179
-
180
-
181
-
182
-
183
-
184
-
185
-
186
-
187
-
188
-
189
-
190
-
191
-
192
-
193
-
194
-
195
-
196
-
197
-
198
-
199
-
200
-
201
-
202
-
203
-
204
-
205
-
206
-
207
-
208
-
209
-
210
-
211
-
212
-
213
-
214
-
215
-
216
-
217
-
218
-
219
-
220
-
221
-
222
-
223
-
224
-
225
-
226
-
227
-
228
-
229
-
230
-
231
-
232
-
233
-
234
-
235
-
236
-
237
-
238
-
239
-
240
-
241
-
242
-
243
-
244
-
245
-
246
-
247
-
248
-
249
-
250
-
251
-
252
-
253
-
254
-
255
-
256
-
257
-
258
-
259
-
260
-
261
-
262
-
263
-
264
-
265
-
266
-
267
-
268
-
269
-
270
-
271
-
272
-
273
-
274
-
275
-
276
-
277
-
278
-
279
-
280
-
281
-
282
-
283
-
284
-
285
-
286
-
287
-
288
-
289
-
290
-
291
-
292
-
293
-
294
-
295
-
296
-
297
-
298
-
299
-
300
-
301
-
302
-
303
-
304
-
305
-
306
-
307
-
308
-
309
-
310
-
311
-
312
 |
 |

59
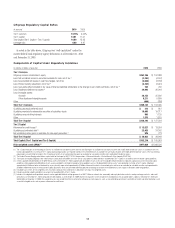
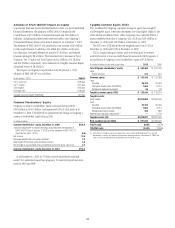
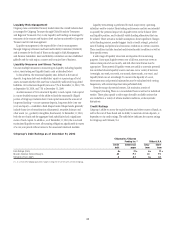
Citigroup Regulatory Capital Ratios
At year end 2010 2009
Tier 1 Common 10.75% 9.60%
Tier 1 Capital 12.91 11.67
Total Capital (Tier 1 Capital + Tier 2 Capital) 16.59 15.25
Leverage ratio 6.60 6.87
As noted in the table above, Citigroup was “well capitalized” under the
current federal bank regulatory agency definitions as of December 31, 2010
and December 31, 2009.
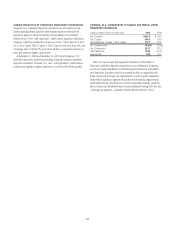
Components of Capital Under Regulatory Guidelines
In millions of dollars at year end 2010 2009
Tier 1 Common
Citigroup common stockholders’ equity $163,156 $ 152,388
Less: Net unrealized losses on securities available-for-sale, net of tax (1) (2,395) (4,347)
Less: Accumulated net losses on cash flow hedges, net of tax (2,650) (3,182)
Less: Pension liability adjustment, net of tax (2) (4,105) (3,461)
Less: Cumulative effect included in fair value of financial liabilities attributable to the change in own credit worthiness, net of tax (3) 164 760
Less: Disallowed deferred tax assets (4) 34,946 26,044
Less: Intangible assets:
Goodwill 26,152 25,392
Other disallowed intangible assets 5,211 5,899
Other (698) (788)
Total Tier 1 Common $105,135 $ 104,495
Qualifying perpetual preferred stock $ 312 $ 312
Qualifying mandatorily redeemable securities of subsidiary trusts 18,003 19,217
Qualifying noncontrolling interests 868 1,135
Other 1,875 1,875
Total Tier 1 Capital $126,193 $ 127,034
Tier 2 Capital
Allowance for credit losses (5) $ 12,627 $ 13,934
Qualifying subordinated debt (6) 22,423 24,242
Net unrealized pretax gains on available-for-sale equity securities (1) 976 773
Total Tier 2 Capital $ 36,026 $ 38,949
Total Capital (Tier 1 Capital and Tier 2 Capital) $162,219 $ 165,983
Risk-weighted assets (RWA) (7) $977,629 $1,088,526
(1) Tier 1 Capital excludes net unrealized gains (losses) on available-for-sale debt securities and net unrealized gains on available-for-sale equity securities with readily determinable fair values, in accordance with risk-
based capital guidelines. In arriving at Tier 1 Capital, banking organizations are required to deduct net unrealized losses on available-for-sale equity securities with readily determinable fair values, net of tax. Banking
organizations are permitted to include in Tier 2 Capital up to 45% of net unrealized pretax gains on available-for-sale equity securities with readily determinable fair values.
(2) The Federal Reserve Board granted interim capital relief for the impact of ASC 715-20, Compensation—Retirement Benefits—Defined Benefits Plans (formerly SFAS 158).
(3) The impact of including Citigroup’s own credit rating in valuing financial liabilities for which the fair value option has been elected is excluded from Tier 1 Capital, in accordance with risk-based capital guidelines.
(4) Of Citi’s approximately $52 billion of net deferred tax assets at December 31, 2010, approximately $13 billion of such assets were includable without limitation in regulatory capital pursuant to risk-based capital
guidelines, while approximately $35 billion of such assets exceeded the limitation imposed by these guidelines and, as “disallowed deferred tax assets,” were deducted in arriving at Tier 1 Capital. Citigroup’s
approximately $4 billion of other net deferred tax assets primarily represented approximately $2 billion of deferred tax effects of unrealized gains and losses on available-for-sale debt securities and approximately
$2 billion of deferred tax effects of the pension liability adjustment, which are permitted to be excluded prior to deriving the amount of net deferred tax assets subject to limitation under the guidelines.
(5) Includable up to 1.25% of risk-weighted assets. Any excess allowance for credit losses is deducted in arriving at risk-weighted assets.
(6) Includes qualifying subordinated debt in an amount not exceeding 50% of Tier 1 Capital.
(7) Includes risk-weighted credit equivalent amounts, net of applicable bilateral netting agreements, of $62.1 billion for interest rate, commodity and equity derivative contracts, foreign exchange contracts, and credit
derivatives as of December 31, 2010, compared with $64.5 billion as of December 31, 2009. Market risk equivalent assets included in risk-weighted assets amounted to $51.4 billion at December 31, 2010 and
$80.8 billion at December 31, 2009. Risk-weighted assets also include the effect of certain other off-balance-sheet exposures, such as unused lending commitments and letters of credit, and reflect deductions such
as certain intangible assets and any excess allowance for credit losses.