Citibank 2010 Annual Report Download - page 30
Download and view the complete annual report
Please find page 30 of the 2010 Citibank annual report below. You can navigate through the pages in the report by either clicking on the pages listed below, or by using the keyword search tool below to find specific information within the annual report.-
 1
1 -
2
-
3
-
4
-
5
-
6
-
7
-
8
-
9
-
10
-
11
-
12
-
13
-
14
-
15
-
16
-
17
-
18
-
19
-
 20
20 -
 21
21 -
 22
22 -
 23
23 -
 24
24 -
 25
25 -
 26
26 -
 27
27 -
 28
28 -
 29
29 -
 30
30 -
 31
31 -
 32
32 -
 33
33 -
 34
34 -
 35
35 -
 36
36 -
 37
37 -
 38
38 -
 39
39 -
 40
40 -
41
-
42
-
43
-
44
-
45
-
46
-
47
-
48
-
49
-
50
-
51
-
52
-
53
-
54
-
55
-
56
-
57
-
58
-
59
-
60
-
61
-
62
-
63
-
64
-
65
-
66
-
67
-
68
-
69
-
70
-
71
-
72
-
73
-
74
-
75
-
76
-
77
-
78
-
79
-
80
-
81
-
82
-
83
-
84
-
85
-
86
-
87
-
88
-
89
-
90
-
91
-
92
-
93
-
94
-
95
-
96
-
97
-
98
-
99
-
100
-
101
-
102
-
103
-
104
-
105
-
106
-
107
-
108
-
109
-
110
-
111
-
112
-
113
-
114
-
115
-
116
-
117
-
118
-
119
-
120
-
121
-
122
-
123
-
124
-
125
-
126
-
127
-
128
-
129
-
130
-
131
-
132
-
133
-
134
-
135
-
136
-
137
-
138
-
139
-
140
-
141
-
142
-
143
-
144
-
145
-
146
-
147
-
148
-
149
-
150
-
151
-
152
-
153
-
154
-
155
-
156
-
157
-
158
-
159
-
160
-
161
-
162
-
163
-
164
-
165
-
166
-
167
-
168
-
169
-
170
-
171
-
172
-
173
-
174
-
175
-
176
-
177
-
178
-
179
-
180
-
181
-
182
-
183
-
184
-
185
-
186
-
187
-
188
-
189
-
190
-
191
-
192
-
193
-
194
-
195
-
196
-
197
-
198
-
199
-
200
-
201
-
202
-
203
-
204
-
205
-
206
-
207
-
208
-
209
-
210
-
211
-
212
-
213
-
214
-
215
-
216
-
217
-
218
-
219
-
220
-
221
-
222
-
223
-
224
-
225
-
226
-
227
-
228
-
229
-
230
-
231
-
232
-
233
-
234
-
235
-
236
-
237
-
238
-
239
-
240
-
241
-
242
-
243
-
244
-
245
-
246
-
247
-
248
-
249
-
250
-
251
-
252
-
253
-
254
-
255
-
256
-
257
-
258
-
259
-
260
-
261
-
262
-
263
-
264
-
265
-
266
-
267
-
268
-
269
-
270
-
271
-
272
-
273
-
274
-
275
-
276
-
277
-
278
-
279
-
280
-
281
-
282
-
283
-
284
-
285
-
286
-
287
-
288
-
289
-
290
-
291
-
292
-
293
-
294
-
295
-
296
-
297
-
298
-
299
-
300
-
301
-
302
-
303
-
304
-
305
-
306
-
307
-
308
-
309
-
310
-
311
-
312
 |
 |

28
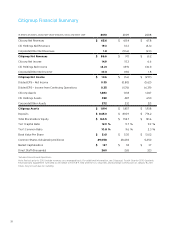
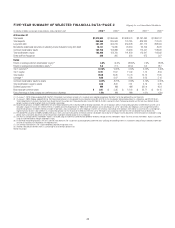
RESULTS OF OPERATIONS
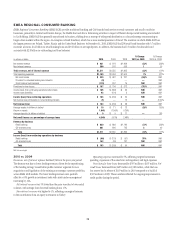
FIVE-YEAR SUMMARY OF SELECTED FINANCIAL DATA—PAGE 1 Citigroup Inc. and Consolidated Subsidiaries
In millions of dollars, except per-share amounts, ratios and direct staff 2010 (1)(2) 2009 (2) 2008 (2) 2007 (2) 2006 (2)
Net interest revenue $ 54,652 $ 48,914 $ 53,749 $ 45,389 $ 37,928
Non-interest revenue 31,949 31,371 (2,150) 31,911 48,399
Revenues, net of interest expense $ 86,601 $ 80,285 $ 51,599 $ 77,300 $ 86,327
Operating expenses 47,375 47,822 69,240 58,737 50,301
Provisions for credit losses and for benefits and claims 26,042 40,262 34,714 17,917 7,537
Income (loss) from continuing operations before income taxes $ 13,184 $ (7,799) $ (52,355) $ 646 $ 28,489
Income taxes (benefits) 2,233 (6,733) (20,326) (2,546) 7,749
Income (loss) from continuing operations $ 10,951 $ (1,066) $ (32,029) $ 3,192 $ 20,740
Income (loss) from discontinued operations, net of taxes (3) (68) (445) 4,002 708 1,087
Net income (loss) before attribution of noncontrolling interests $ 10,883 $ (1,511) $ (28,027) $ 3,900 $ 21,827
Net income (loss) attributable to noncontrolling interests 281 95 (343) 283 289
Citigroup’s net income (loss) $ 10,602 $ (1,606) $ (27,684) $ 3,617 $ 21,538
Less:
Preferred dividends–Basic $ 9 $ 2,988 $ 1,695 $ 36 $ 64
Impact of the conversion price reset related to the $12.5 billion
convertible preferred stock private issuance—Basic —1,285 — — —
Preferred stock Series H discount accretion—Basic —123 37 — —
Impact of the public and private preferred stock exchange offer —3,242 — — —
Dividends and undistributed earnings allocated to participating
securities, applicable to Basic EPS 90 2 221 261 512
Income (loss) allocated to unrestricted common shareholders for basic EPS $ 10,503 $ (9,246) $ (29,637) $ 3,320 $ 20,962
Less: Convertible preferred stock dividends —(540) (877) — —
Add: Incremental dividends and undistributed earnings allocated to participating securities,
applicable to Diluted EPS 2— — — 2
Income (loss) allocated to unrestricted common shareholders for diluted EPS $ 10,505 $ (8,706) $ (28,760) $ 3,320 $ 20,964
Earnings per share
Basic
Income (loss) from continuing operations 0.37 (0.76) (6.39) 0.53 4.07
Net income (loss) 0.36 (0.80) (5.63) 0.68 4.29
Diluted (4)
Income (loss) from continuing operations $ 0.35 $ (0.76) $ (6.39) $ 0.53 $ 4.05
Net income (loss) 0.35 (0.80) (5.63) 0.67 4.27
Dividends declared per common share 0.00 0.01 1.12 2.16 1.96
Statement continues on the next page, including notes to the table.