Citibank 2010 Annual Report Download - page 186
Download and view the complete annual report
Please find page 186 of the 2010 Citibank annual report below. You can navigate through the pages in the report by either clicking on the pages listed below, or by using the keyword search tool below to find specific information within the annual report.-
 1
1 -
2
-
3
-
4
-
5
-
6
-
7
-
8
-
9
-
10
-
11
-
12
-
13
-
14
-
15
-
16
-
17
-
18
-
19
-
20
-
21
-
22
-
23
-
24
-
25
-
26
-
27
-
28
-
29
-
30
-
31
-
32
-
33
-
34
-
35
-
36
-
37
-
38
-
39
-
40
-
41
-
42
-
43
-
44
-
45
-
46
-
47
-
48
-
49
-
50
-
51
-
52
-
53
-
54
-
55
-
56
-
57
-
58
-
59
-
60
-
61
-
62
-
63
-
64
-
65
-
66
-
67
-
68
-
69
-
70
-
71
-
72
-
73
-
74
-
75
-
76
-
77
-
78
-
79
-
80
-
81
-
82
-
83
-
84
-
85
-
86
-
87
-
88
-
89
-
90
-
91
-
92
-
93
-
94
-
95
-
96
-
97
-
98
-
99
-
100
-
101
-
102
-
103
-
104
-
105
-
106
-
107
-
108
-
109
-
110
-
111
-
112
-
113
-
114
-
115
-
116
-
117
-
118
-
119
-
120
-
121
-
122
-
123
-
124
-
125
-
126
-
127
-
128
-
129
-
130
-
131
-
132
-
133
-
134
-
135
-
136
-
137
-
138
-
139
-
140
-
141
-
142
-
143
-
144
-
145
-
146
-
147
-
148
-
149
-
150
-
151
-
152
-
153
-
154
-
155
-
156
-
157
-
158
-
159
-
160
-
161
-
162
-
163
-
164
-
165
-
166
-
167
-
168
-
169
-
170
-
171
-
172
-
173
-
174
-
175
-
 176
176 -
 177
177 -
 178
178 -
 179
179 -
 180
180 -
 181
181 -
 182
182 -
 183
183 -
 184
184 -
 185
185 -
 186
186 -
 187
187 -
 188
188 -
 189
189 -
 190
190 -
 191
191 -
 192
192 -
 193
193 -
 194
194 -
 195
195 -
 196
196 -
197
-
198
-
199
-
200
-
201
-
202
-
203
-
204
-
205
-
206
-
207
-
208
-
209
-
210
-
211
-
212
-
213
-
214
-
215
-
216
-
217
-
218
-
219
-
220
-
221
-
222
-
223
-
224
-
225
-
226
-
227
-
228
-
229
-
230
-
231
-
232
-
233
-
234
-
235
-
236
-
237
-
238
-
239
-
240
-
241
-
242
-
243
-
244
-
245
-
246
-
247
-
248
-
249
-
250
-
251
-
252
-
253
-
254
-
255
-
256
-
257
-
258
-
259
-
260
-
261
-
262
-
263
-
264
-
265
-
266
-
267
-
268
-
269
-
270
-
271
-
272
-
273
-
274
-
275
-
276
-
277
-
278
-
279
-
280
-
281
-
282
-
283
-
284
-
285
-
286
-
287
-
288
-
289
-
290
-
291
-
292
-
293
-
294
-
295
-
296
-
297
-
298
-
299
-
300
-
301
-
302
-
303
-
304
-
305
-
306
-
307
-
308
-
309
-
310
-
311
-
312
 |
 |

184
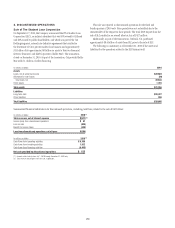
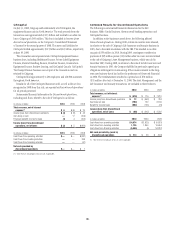
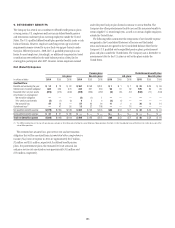
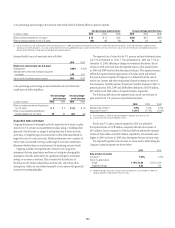
7. PRINCIPAL TRANSACTIONS
Principal transactions revenue consists of realized and unrealized gains
and losses from trading activities. Trading activities include revenues from
fixed income, equities, credit and commodities products, as well as foreign
exchange transactions. Not included in the table below is the impact of
net interest revenue related to trading activities, which is an integral part
of trading activities’ profitability. The following table presents principal
transactions revenue for the years ended December 31:
In millions of dollars 2010 2009 2008
Regional Consumer Banking $ 533 $ 1,569 $ (146)
Institutional Clients Group 5,567 5,626 6,102
Subtotal Citicorp $6,100 $ 7,195 $ 5,956
Local Consumer Lending (217) 896 504
Brokerage and Asset Management (37) 30 (4,958)
Special Asset Pool 2,078 (2,606) (26,270)
Subtotal Citi Holdings $1,824 $(1,680) $(30,724)
Corporate/Other (407) 553 879
Total Citigroup $7,517 $ 6,068 $(23,889)
In millions of dollars 2010 2009 2008
Interest rate contracts (1) $3,231 $ 6,211 $(10,369)
Foreign exchange contracts (2) 1,852 2,762 3,921
Equity contracts (3) 995 (334) (958)
Commodity and other contracts (4) 126 924 970
Credit derivatives (5) 1,313 (3,495) (17,453)
Total Citigroup $7,517 $ 6,068 $(23,889)
(1) Includes revenues from government securities and corporate debt, municipal securities, preferred
stock, mortgage securities, and other debt instruments. Also includes spot and forward trading of
currencies and exchange-traded and over-the-counter (OTC) currency options, options on fixed
income securities, interest rate swaps, currency swaps, swap options, caps and floors, financial
futures, OTC options, and forward contracts on fixed income securities.
(2) Includes revenues from foreign exchange spot, forward, option and swap contracts, as well as
translation gains and losses.
(3) Includes revenues from common, preferred and convertible preferred stock, convertible corporate
debt, equity-linked notes, and exchange-traded and OTC equity options and warrants.
(4) Primarily includes revenues from crude oil, refined oil products, natural gas, and other commodities
trades.
(5) Includes revenues from structured credit products.
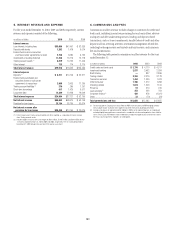
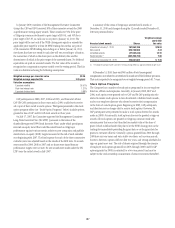
8. INCENTIVE PLANS
The Company has adopted a number of equity compensation plans under
which it currently administers award programs involving grants of stock
options, restricted or deferred stock awards, and stock payments. The award
programs are used to attract, retain and motivate officers, employees and
non-employee directors, to provide incentives for their contributions to the
long-term performance and growth of the Company, and to align their
interests with those of stockholders. Certain of these equity issuances also
increase the Company’s stockholders’ equity. The plans and award programs
are administered by the Personnel and Compensation Committee of the
Citigroup Board of Directors (the Committee), which is composed entirely of
independent non-employee directors. Since April 19, 2005, all equity awards
have been pursuant to stockholder-approved plans.
At December 31, 2010, approximately 806.22 million shares were
authorized and available for grant under Citigroup’s 2009 Stock Incentive
Plan. Citigroup’s general practice has been to deliver shares from treasury
stock upon the exercise or vesting of equity awards. However, newly issued
shares were issued as stock payments in April 2010 to settle common stock
equivalent awards granted in January 2010. Newly issued shares were also
issued as stock payments in January 2011. Citigroup will be reviewing its
general practice in 2011 and might begin using newly issued shares more
regularly in 2011 or 2012 as an alternative to treasury shares. There is no
income statement difference between treasury stock issuances and newly
issued share issuances.
The following table shows components of compensation expense relating
to the Company’s stock-based compensation programs as recorded during
2010, 2009 and 2008:
In millions of dollars 2010 2009 2008
Charges for estimated awards to
retirement -eligible employees $ 366 $ 207 $ 110
Option expense 197 55 29
Amortization of deferred cash awards and
deferred cash stock units 280 113 —
Amortization of MC LTIP awards (1) —19 18
Amortization of salary stock awards 173 162 —
Amortization of restricted and deferred
stock awards (2) 747 1,543 3,133
Total $1,763 $2,099 $3,290
(1) Management Committee Long-Term Incentive Plan (MC LTIP) awards were granted in 2007. The
awards expired in December 2009 without the issuance of shares.
(2) The 2008 period includes amortization of expense over the remaining life of all unvested, restricted
and deferred stock awards granted to all employees prior to 2006. All periods include amortization
expense for all unvested awards to non-retirement-eligible employees on or after January 1, 2006.
Amortization is recognized net of estimated forfeitures of awards.