Citibank 2010 Annual Report Download - page 103
Download and view the complete annual report
Please find page 103 of the 2010 Citibank annual report below. You can navigate through the pages in the report by either clicking on the pages listed below, or by using the keyword search tool below to find specific information within the annual report.-
 1
1 -
2
-
3
-
4
-
5
-
6
-
7
-
8
-
9
-
10
-
11
-
12
-
13
-
14
-
15
-
16
-
17
-
18
-
19
-
20
-
21
-
22
-
23
-
24
-
25
-
26
-
27
-
28
-
29
-
30
-
31
-
32
-
33
-
34
-
35
-
36
-
37
-
38
-
39
-
40
-
41
-
42
-
43
-
44
-
45
-
46
-
47
-
48
-
49
-
50
-
51
-
52
-
53
-
54
-
55
-
56
-
57
-
58
-
59
-
60
-
61
-
62
-
63
-
64
-
65
-
66
-
67
-
68
-
69
-
70
-
71
-
72
-
73
-
74
-
75
-
76
-
77
-
78
-
79
-
80
-
81
-
82
-
83
-
84
-
85
-
86
-
87
-
88
-
89
-
90
-
91
-
92
-
 93
93 -
 94
94 -
 95
95 -
 96
96 -
 97
97 -
 98
98 -
 99
99 -
 100
100 -
 101
101 -
 102
102 -
 103
103 -
 104
104 -
 105
105 -
 106
106 -
 107
107 -
 108
108 -
 109
109 -
 110
110 -
 111
111 -
 112
112 -
 113
113 -
114
-
115
-
116
-
117
-
118
-
119
-
120
-
121
-
122
-
123
-
124
-
125
-
126
-
127
-
128
-
129
-
130
-
131
-
132
-
133
-
134
-
135
-
136
-
137
-
138
-
139
-
140
-
141
-
142
-
143
-
144
-
145
-
146
-
147
-
148
-
149
-
150
-
151
-
152
-
153
-
154
-
155
-
156
-
157
-
158
-
159
-
160
-
161
-
162
-
163
-
164
-
165
-
166
-
167
-
168
-
169
-
170
-
171
-
172
-
173
-
174
-
175
-
176
-
177
-
178
-
179
-
180
-
181
-
182
-
183
-
184
-
185
-
186
-
187
-
188
-
189
-
190
-
191
-
192
-
193
-
194
-
195
-
196
-
197
-
198
-
199
-
200
-
201
-
202
-
203
-
204
-
205
-
206
-
207
-
208
-
209
-
210
-
211
-
212
-
213
-
214
-
215
-
216
-
217
-
218
-
219
-
220
-
221
-
222
-
223
-
224
-
225
-
226
-
227
-
228
-
229
-
230
-
231
-
232
-
233
-
234
-
235
-
236
-
237
-
238
-
239
-
240
-
241
-
242
-
243
-
244
-
245
-
246
-
247
-
248
-
249
-
250
-
251
-
252
-
253
-
254
-
255
-
256
-
257
-
258
-
259
-
260
-
261
-
262
-
263
-
264
-
265
-
266
-
267
-
268
-
269
-
270
-
271
-
272
-
273
-
274
-
275
-
276
-
277
-
278
-
279
-
280
-
281
-
282
-
283
-
284
-
285
-
286
-
287
-
288
-
289
-
290
-
291
-
292
-
293
-
294
-
295
-
296
-
297
-
298
-
299
-
300
-
301
-
302
-
303
-
304
-
305
-
306
-
307
-
308
-
309
-
310
-
311
-
312
 |
 |

101
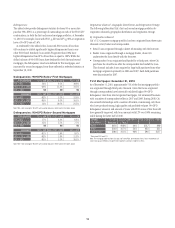
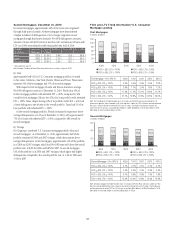
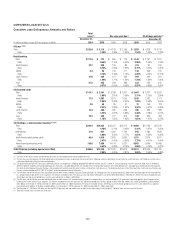
North America Cards—FICO Information
As set forth in the table below, approximately 77% of the Citi-branded
portfolio had FICO credit scores of at least 660 on a refreshed basis as of
December 31, 2010, while 69% of the retail partner cards portfolio had scores
of 660 or above. These percentages reflect an improvement during 2010.
Balances: December 31, 2010
Refreshed Citi-Branded Retail Partner
FICO ≥ 660 77% 69%
620 ≤ FICO < 660 9% 13%
FICO < 620 14% 18%
Note: Based on balances of $119 billion (increased from $116 billion at September 30, 2010). Balances
include interest and fees. Excludes Canada, Puerto Rico and Installment and Classified portfolios. Excludes
balances where FICO was unavailable ($0.5 billion for Citi-branded, $1.7 billion for retail partner cards).
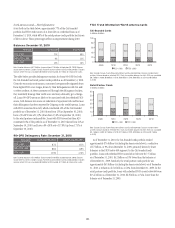
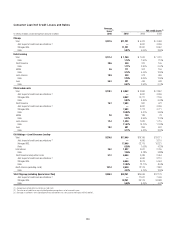
The table below provides delinquency statistics for loans 90+DPD for both
the Citi-branded and retail partner cards portfolios as of December 31, 2010.
Given the economic environment, customers have generally migrated down
from higher FICO score ranges, driven by their delinquencies with Citi and/
or other creditors. As these customers roll through the delinquency buckets,
they materially damage their credit score and may ultimately go to charge-
off. Loans 90+DPD are more likely to be associated with low refreshed FICO
scores, both because low scores are indicative of repayment risk and because
their delinquency has been reported by Citigroup to the credit bureaus. Loans
with FICO scores less than 620, which constituted 14% of the Citi-branded
portfolio as of December 31, 2010 (down from 15% at September 30, 2010),
have a 90+DPD rate of 13.9% (down from 15.0% at September 30, 2010).
In the retail partner cards portfolio, loans with FICO scores less than 620
constituted 18% of the portfolio as of December 31, 2010 (down from 21% at
September 30, 2010) and have a 90+DPD rate of 17.8% (up from 17.3% at
September 30, 2010).
90+DPD Delinquency Rate: December 31, 2010
Refreshed Citi-Branded 90+DPD% Retail Partner 90+DPD%
FICO ≥ 660 0.1% 0.1%
620 ≤ FICO < 660 0.6% 0.9%
FICO < 620 13.9% 17.8%
Note: Based on balances of $119 billion (increased from $116 billion at September 30, 2010). Balances
include interest and fees. Excludes Canada, Puerto Rico and Installment and Classified portfolios. Excludes
balances where FICO was unavailable ($0.5 billion for Citi-branded, $1.7 billion for retail partner cards).
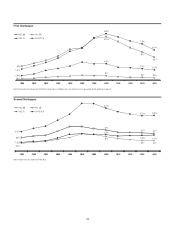
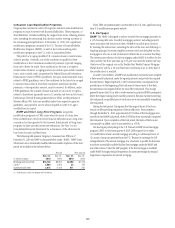
FICO Trend Information—North America Cards
21.9 20.9 20.0 18.5 17.7
61.2 55.6 57.4 58.3
0
20
40
60
80
100
4Q09 1Q10 2Q10 3Q10 4Q10
FICO < 660 FICO ≥ 660
Citi-Branded Cards
In billions of dollars
55.2
Note: Excludes Canada, Puerto Rico and Installment and Classified portfolios. Balances include interest
and fees. Balances based on refreshed FICO. Chart also excludes balances for which FICO was unavailable
($0.7 billion in 4Q09, $0.6 billion in 1Q10, $0.6 billion in 2Q10, $0.6 billion in 3Q10 and $0.5 billion
in 4Q10).
FICO < 660 FICO ≥ 660
Retail Partner Cards
In billions of dollars
20.0 18.3 16.3 14.6 13.2
34.2 30.2 30.0 27.7 30.0
0
10
20
30
40
50
60
4Q09 1Q10 2Q10 3Q10 4Q10
Note: Excludes Canada, Puerto Rico and Installment and Classified portfolios. Balances include interest
and fees. Balances based on refreshed FICO. Chart also excludes balances for which FICO was unavailable
($2.1 billion in 4Q09, $2.1 billion in 1Q10, $2.1 billion in 2Q10, $2.0 billion in 3Q10 and $1.7 billion
in 4Q10).
As of December 31, 2010, the Citi-branded cards portfolio totaled
approximately $76 billion (excluding the items noted above), a reduction
of $7 billion, or 9%, from December 31, 2009, primarily driven by lower
balances in the FICO below 660 segment. In the Citi-branded cards
portfolio, loans with refreshed FICO scores below 660 were $17.7 billion
as of December 31, 2010, $4.2 billion or 19% lower than the balance as
of December 31, 2009. Similarly, the retail partner cards portfolio was
approximately $43 billion (excluding the items noted above) as of December
31, 2010, a reduction of $11 billion, or 20%, from December 31, 2009. In the
retail partner cards portfolio, loans with refreshed FICO scores below 660 were
$13.2 billion as of December 31, 2010, $6.8 billion, or 34%, lower than the
balance as of December 31, 2009.