Citibank 2010 Annual Report Download - page 66
Download and view the complete annual report
Please find page 66 of the 2010 Citibank annual report below. You can navigate through the pages in the report by either clicking on the pages listed below, or by using the keyword search tool below to find specific information within the annual report.-
 1
1 -
2
-
3
-
4
-
5
-
6
-
7
-
8
-
9
-
10
-
11
-
12
-
13
-
14
-
15
-
16
-
17
-
18
-
19
-
20
-
21
-
22
-
23
-
24
-
25
-
26
-
27
-
28
-
29
-
30
-
31
-
32
-
33
-
34
-
35
-
36
-
37
-
38
-
39
-
40
-
41
-
42
-
43
-
44
-
45
-
46
-
47
-
48
-
49
-
50
-
51
-
52
-
53
-
54
-
55
-
 56
56 -
 57
57 -
 58
58 -
 59
59 -
 60
60 -
 61
61 -
 62
62 -
 63
63 -
 64
64 -
 65
65 -
 66
66 -
 67
67 -
 68
68 -
 69
69 -
 70
70 -
 71
71 -
 72
72 -
 73
73 -
 74
74 -
 75
75 -
 76
76 -
77
-
78
-
79
-
80
-
81
-
82
-
83
-
84
-
85
-
86
-
87
-
88
-
89
-
90
-
91
-
92
-
93
-
94
-
95
-
96
-
97
-
98
-
99
-
100
-
101
-
102
-
103
-
104
-
105
-
106
-
107
-
108
-
109
-
110
-
111
-
112
-
113
-
114
-
115
-
116
-
117
-
118
-
119
-
120
-
121
-
122
-
123
-
124
-
125
-
126
-
127
-
128
-
129
-
130
-
131
-
132
-
133
-
134
-
135
-
136
-
137
-
138
-
139
-
140
-
141
-
142
-
143
-
144
-
145
-
146
-
147
-
148
-
149
-
150
-
151
-
152
-
153
-
154
-
155
-
156
-
157
-
158
-
159
-
160
-
161
-
162
-
163
-
164
-
165
-
166
-
167
-
168
-
169
-
170
-
171
-
172
-
173
-
174
-
175
-
176
-
177
-
178
-
179
-
180
-
181
-
182
-
183
-
184
-
185
-
186
-
187
-
188
-
189
-
190
-
191
-
192
-
193
-
194
-
195
-
196
-
197
-
198
-
199
-
200
-
201
-
202
-
203
-
204
-
205
-
206
-
207
-
208
-
209
-
210
-
211
-
212
-
213
-
214
-
215
-
216
-
217
-
218
-
219
-
220
-
221
-
222
-
223
-
224
-
225
-
226
-
227
-
228
-
229
-
230
-
231
-
232
-
233
-
234
-
235
-
236
-
237
-
238
-
239
-
240
-
241
-
242
-
243
-
244
-
245
-
246
-
247
-
248
-
249
-
250
-
251
-
252
-
253
-
254
-
255
-
256
-
257
-
258
-
259
-
260
-
261
-
262
-
263
-
264
-
265
-
266
-
267
-
268
-
269
-
270
-
271
-
272
-
273
-
274
-
275
-
276
-
277
-
278
-
279
-
280
-
281
-
282
-
283
-
284
-
285
-
286
-
287
-
288
-
289
-
290
-
291
-
292
-
293
-
294
-
295
-
296
-
297
-
298
-
299
-
300
-
301
-
302
-
303
-
304
-
305
-
306
-
307
-
308
-
309
-
310
-
311
-
312
 |
 |

64
FUNDING AND LIQUIDITY
Overview
Citi’s funding and liquidity objective is to both fund its existing asset base
and maintain sufficient excess liquidity so that it can operate under a wide
variety of market conditions. An extensive range of liquidity scenarios is
considered based on both historical industry experience and hypothetical
situations. The approach is to ensure Citi has sufficient funding that is
structural in nature so as to accommodate market disruptions for both
short- and long-term periods. Due to various constraints that limit the free
transfer of liquidity or capital between Citi-affiliated entities (as discussed
below), Citigroup’s primary liquidity objectives are established by entity, and
in aggregate, across:
(i) the non-bank, which is largely comprised of the parent holding
company (Citigroup), Citigroup Funding Inc. (CFI) and Citi’s broker-
dealer subsidiaries (collectively referred to in this section as “non-
bank”); and
(ii) Citi’s bank subsidiaries, such as Citibank, N.A.
At an aggregate level, Citigroup’s goal is to ensure that there is sufficient
funding in amount and tenor to ensure that aggregate liquidity resources
are available for these entities. The liquidity framework requires that entities
be self-sufficient or net providers of liquidity in their designated stress tests
and have excess cash capital (as further discussed in “Liquidity Measures and
Stress Testing” below).
The primary sources of funding include (i) deposits via Citi’s bank
subsidiaries, which are Citi’s most stable and lowest-cost source of long-
term funding, (ii) long-term debt (including trust preferred securities and
other long-term collateralized financing) issued at the non-bank level
and certain bank subsidiaries, and (iii) stockholders’ equity. These sources
are supplemented by short-term borrowings, primarily in the form of
commercial paper and secured financing (securities loaned or sold under
agreements to repurchase) at the non-bank level.
Citigroup works to ensure that the structural tenor of these funding
sources is sufficiently long in relation to the tenor of its asset base. In fact,
the key goal of Citi’s asset-liability management is to ensure that there is
excess tenor in the liability structure so as to provide excess liquidity to fund
the assets. The excess liquidity resulting from a longer-term tenor profile can
effectively offset potential downward pressures on liquidity that may occur
under stress. This excess funding is held in the form of aggregate liquidity
resources, as described below.
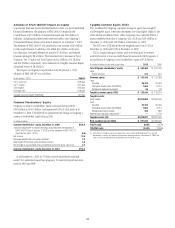
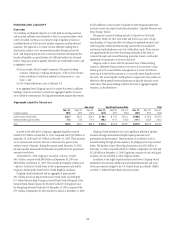
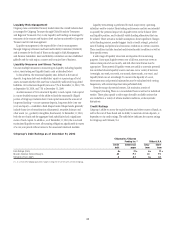
Aggregate Liquidity Resources
Non-bank Significant bank entities Total
In billions of dollars
Dec. 31,
2010
Sept. 30,
2010
Dec. 31,
2009
Dec. 31,
2010
Sept. 30,
2010
Dec. 31,
2009
Dec. 31,
2010
Sept. 30,
2010
Dec. 31,
2009
Cash at major central banks $22.7 $16.1 $10.4 $ 82.1 $ 79.1 $105.1 $104.8 $ 95.2 $115.5
Unencumbered liquid securities 71.8 73.9 76.4 145.3 161.7 123.6 217.1 235.6 200.0
Total $94.5 $90.0 $86.8 $227.4 $240.8 $228.7 $321.9 $330.8 $315.5
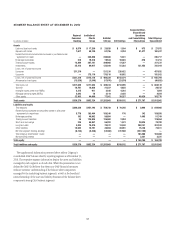
As noted in the table above, Citigroup’s aggregate liquidity resources
totaled $321.9 billion at December 31, 2010, compared with $330.8 billion at
September 30, 2010 and $315.5 billion at December 31, 2009. These amounts
are as of period-end, and may increase or decrease intra-period in the
ordinary course of business. During the quarter ended December 31, 2010,
the intra-quarter amounts did not fluctuate materially from the quarter-end
amounts noted above.
At December 31, 2010, Citigroup’s non-bank “cash box” totaled
$94.5 billion, compared with $90.0 billion at September 30, 2010 and
$86.8 billion at December 31, 2009. This includes the liquidity portfolio and
“cash box” held in the United States as well as government bonds held by
Citigroup’s broker-dealer entities in the United Kingdom and Japan.
Citigroup’s bank subsidiaries had an aggregate of approximately
$82.1 billion of cash on deposit with major central banks (including the
U.S. Federal Reserve Bank, European Central Bank, Bank of England, Swiss
National Bank, Bank of Japan, the Monetary Authority of Singapore, and
the Hong Kong Monetary Authority) at December 31, 2010, compared with
$79.1 billion at September 30, 2010 and $105.1 billion at December 31, 2009.
Citigroup’s bank subsidiaries also have significant additional liquidity
resources through unencumbered highly liquid government and
government-backed securities. These securities are available for sale or
secured funding through private markets or by pledging to the major central
banks. The liquidity value of these liquid securities was $145.3 billion at
December 31, 2010, compared with $161.7 billion at September 30, 2010 and
$123.6 billion at December 31, 2009. Significant amounts of cash and liquid
securities are also available in other Citigroup entities.
In addition to the highly liquid securities noted above, Citigroup’s bank
subsidiaries also maintain additional unencumbered securities and loans,
which are currently pledged to the U.S. Federal Home Loan Banks’ (FHLB)
and the U.S. Federal Reserve Bank’s discount window.