Citibank 2010 Annual Report Download - page 134
Download and view the complete annual report
Please find page 134 of the 2010 Citibank annual report below. You can navigate through the pages in the report by either clicking on the pages listed below, or by using the keyword search tool below to find specific information within the annual report.-
 1
1 -
2
-
3
-
4
-
5
-
6
-
7
-
8
-
9
-
10
-
11
-
12
-
13
-
14
-
15
-
16
-
17
-
18
-
19
-
20
-
21
-
22
-
23
-
24
-
25
-
26
-
27
-
28
-
29
-
30
-
31
-
32
-
33
-
34
-
35
-
36
-
37
-
38
-
39
-
40
-
41
-
42
-
43
-
44
-
45
-
46
-
47
-
48
-
49
-
50
-
51
-
52
-
53
-
54
-
55
-
56
-
57
-
58
-
59
-
60
-
61
-
62
-
63
-
64
-
65
-
66
-
67
-
68
-
69
-
70
-
71
-
72
-
73
-
74
-
75
-
76
-
77
-
78
-
79
-
80
-
81
-
82
-
83
-
84
-
85
-
86
-
87
-
88
-
89
-
90
-
91
-
92
-
93
-
94
-
95
-
96
-
97
-
98
-
99
-
100
-
101
-
102
-
103
-
104
-
105
-
106
-
107
-
108
-
109
-
110
-
111
-
112
-
113
-
114
-
115
-
116
-
117
-
118
-
119
-
120
-
121
-
122
-
123
-
 124
124 -
 125
125 -
 126
126 -
 127
127 -
 128
128 -
 129
129 -
 130
130 -
 131
131 -
 132
132 -
 133
133 -
 134
134 -
 135
135 -
 136
136 -
 137
137 -
 138
138 -
 139
139 -
 140
140 -
 141
141 -
 142
142 -
 143
143 -
 144
144 -
145
-
146
-
147
-
148
-
149
-
150
-
151
-
152
-
153
-
154
-
155
-
156
-
157
-
158
-
159
-
160
-
161
-
162
-
163
-
164
-
165
-
166
-
167
-
168
-
169
-
170
-
171
-
172
-
173
-
174
-
175
-
176
-
177
-
178
-
179
-
180
-
181
-
182
-
183
-
184
-
185
-
186
-
187
-
188
-
189
-
190
-
191
-
192
-
193
-
194
-
195
-
196
-
197
-
198
-
199
-
200
-
201
-
202
-
203
-
204
-
205
-
206
-
207
-
208
-
209
-
210
-
211
-
212
-
213
-
214
-
215
-
216
-
217
-
218
-
219
-
220
-
221
-
222
-
223
-
224
-
225
-
226
-
227
-
228
-
229
-
230
-
231
-
232
-
233
-
234
-
235
-
236
-
237
-
238
-
239
-
240
-
241
-
242
-
243
-
244
-
245
-
246
-
247
-
248
-
249
-
250
-
251
-
252
-
253
-
254
-
255
-
256
-
257
-
258
-
259
-
260
-
261
-
262
-
263
-
264
-
265
-
266
-
267
-
268
-
269
-
270
-
271
-
272
-
273
-
274
-
275
-
276
-
277
-
278
-
279
-
280
-
281
-
282
-
283
-
284
-
285
-
286
-
287
-
288
-
289
-
290
-
291
-
292
-
293
-
294
-
295
-
296
-
297
-
298
-
299
-
300
-
301
-
302
-
303
-
304
-
305
-
306
-
307
-
308
-
309
-
310
-
311
-
312
 |
 |

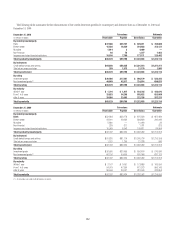
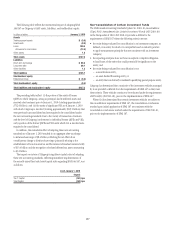
132
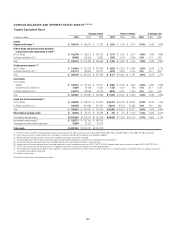
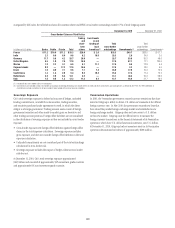
The following tables summarize the key characteristics of Citi’s credit derivatives portfolio by counterparty and derivative form as of December 31, 2010 and
December 31, 2009:
December 31, 2010 Fair values Notionals
In millions of dollars Receivable Payable Beneficiary Guarantor
By industry/counterparty
Bank $37,586 $35,727 $ 820,211 $ 784,080
Broker-dealer 15,428 16,239 319,625 312,131
Monoline 1,914 2 4,409 —
Non-financial 93 70 1,277 1,463
Insurance and other financial institutions 10,108 7,760 177,171 125,442
Total by industry/counterparty $65,129 $59,798 $1,322,693 $1,223,116
By instrument
Credit default swaps and options $64,840 $58,225 $1,301,514 $1,221,211
Total return swaps and other 289 1,573 21,179 1,905
Total by instrument $65,129 $59,798 $1,322,693 $1,223,116
By rating
Investment grade $20,480 $17,281 $ 598,179 $ 532,283
Non-investment grade (1) 44,649 42,517 724,514 690,833
Total by rating $65,129 $59,798 $1,322,693 $1,223,116
By maturity
Within 1 year $ 1,716 $ 1,817 $ 164,735 $ 162,075
From 1 to 5 years 33,853 34,298 935,632 853,808
After 5 years 29,560 23,683 222,326 207,233
Total by maturity $65,129 $59,798 $1,322,693 $1,223,116
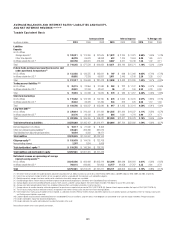
December 31, 2009 Fair values Notionals
In millions of dollars Receivable Payable Beneficiary Guarantor
By industry/counterparty
Bank $ 52,383 $ 50,778 $ 872,523 $ 807,484
Broker-dealer 23,241 22,932 338,829 340,949
Monoline 5,860 — 10,018 33
Non-financial 339 371 1,781 623
Insurance and other financial institutions 10,969 8,343 109,811 64,964
Total by industry/counterparty $ 92,792 $ 82,424 $1,332,962 $1,214,053
By instrument
Credit default swaps and options $ 91,625 $ 81,174 $1,305,724 $1,213,208
Total return swaps and other 1,167 1,250 27,238 845
Total by instrument $ 92,792 $ 82,424 $1,332,962 $1,214,053
By rating
Investment grade $26,666 $22,469 $ 656,876 $ 576,930
Non-investment grade (1) 66,126 59,955 676,086 637,123
Total by rating $ 92,792 $ 82,424 $1,332,962 $1,214,053
By maturity
Within 1 year $ 2,167 $ 2,067 $ 173,880 $ 165,056
From 1 to 5 years 54,079 47,350 877,573 806,143
After 5 years 36,546 33,007 281,509 242,854
Total by maturity $ 92,792 $ 82,424 $1,332,962 $1,214,053
(1) Also includes not rated credit derivative instruments.