Citibank 2010 Annual Report Download - page 234
Download and view the complete annual report
Please find page 234 of the 2010 Citibank annual report below. You can navigate through the pages in the report by either clicking on the pages listed below, or by using the keyword search tool below to find specific information within the annual report.-
 1
1 -
2
-
3
-
4
-
5
-
6
-
7
-
8
-
9
-
10
-
11
-
12
-
13
-
14
-
15
-
16
-
17
-
18
-
19
-
20
-
21
-
22
-
23
-
24
-
25
-
26
-
27
-
28
-
29
-
30
-
31
-
32
-
33
-
34
-
35
-
36
-
37
-
38
-
39
-
40
-
41
-
42
-
43
-
44
-
45
-
46
-
47
-
48
-
49
-
50
-
51
-
52
-
53
-
54
-
55
-
56
-
57
-
58
-
59
-
60
-
61
-
62
-
63
-
64
-
65
-
66
-
67
-
68
-
69
-
70
-
71
-
72
-
73
-
74
-
75
-
76
-
77
-
78
-
79
-
80
-
81
-
82
-
83
-
84
-
85
-
86
-
87
-
88
-
89
-
90
-
91
-
92
-
93
-
94
-
95
-
96
-
97
-
98
-
99
-
100
-
101
-
102
-
103
-
104
-
105
-
106
-
107
-
108
-
109
-
110
-
111
-
112
-
113
-
114
-
115
-
116
-
117
-
118
-
119
-
120
-
121
-
122
-
123
-
124
-
125
-
126
-
127
-
128
-
129
-
130
-
131
-
132
-
133
-
134
-
135
-
136
-
137
-
138
-
139
-
140
-
141
-
142
-
143
-
144
-
145
-
146
-
147
-
148
-
149
-
150
-
151
-
152
-
153
-
154
-
155
-
156
-
157
-
158
-
159
-
160
-
161
-
162
-
163
-
164
-
165
-
166
-
167
-
168
-
169
-
170
-
171
-
172
-
173
-
174
-
175
-
176
-
177
-
178
-
179
-
180
-
181
-
182
-
183
-
184
-
185
-
186
-
187
-
188
-
189
-
190
-
191
-
192
-
193
-
194
-
195
-
196
-
197
-
198
-
199
-
200
-
201
-
202
-
203
-
204
-
205
-
206
-
207
-
208
-
209
-
210
-
211
-
212
-
213
-
214
-
215
-
216
-
217
-
218
-
219
-
220
-
221
-
222
-
223
-
 224
224 -
 225
225 -
 226
226 -
 227
227 -
 228
228 -
 229
229 -
 230
230 -
 231
231 -
 232
232 -
 233
233 -
 234
234 -
 235
235 -
 236
236 -
 237
237 -
 238
238 -
 239
239 -
 240
240 -
 241
241 -
 242
242 -
 243
243 -
 244
244 -
245
-
246
-
247
-
248
-
249
-
250
-
251
-
252
-
253
-
254
-
255
-
256
-
257
-
258
-
259
-
260
-
261
-
262
-
263
-
264
-
265
-
266
-
267
-
268
-
269
-
270
-
271
-
272
-
273
-
274
-
275
-
276
-
277
-
278
-
279
-
280
-
281
-
282
-
283
-
284
-
285
-
286
-
287
-
288
-
289
-
290
-
291
-
292
-
293
-
294
-
295
-
296
-
297
-
298
-
299
-
300
-
301
-
302
-
303
-
304
-
305
-
306
-
307
-
308
-
309
-
310
-
311
-
312
 |
 |

232
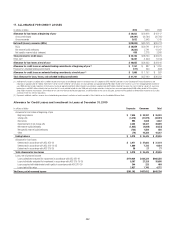
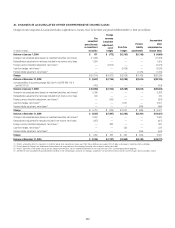
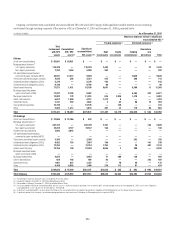
Citigroup’s involvement with consolidated and unconsolidated VIEs with which the Company holds significant variable interests or has continuing
involvement through servicing a majority of the assets in a VIE as of December 31, 2010 and December 31, 2009 is presented below:
In millions of dollars As of December 31, 2010
Maximum exposure to loss in significant
unconsolidated VIEs (1)
Funded exposures (2) Unfunded exposures (3)
Total
involvement
with SPE
assets
Consolidated
VIE / SPE
assets
(4)
Significant
unconsolidated
VIE assets (4)(5)
Debt
investments
Equity
investments
Funding
commitments
Guarantees
and
derivatives Total
Citicorp
Credit card securitizations $ 62,061 $ 62,061 $ — $ — $ — $ — $ — $ — $ 78,833 $ 78,833 $ — $ — $ —
Mortgage securitizations (6) 264,949 264,949 — — —
U.S. agency-sponsored 175,229 — 175,229 2,402 — — 27 2,429
Non-agency-sponsored 7,352 1,454 5,898 302 — — — 302
Citi-administered asset-backed
commercial paper conduits (ABCP) 30,941 21,312 9,629 — — 9,629 — 9,629 36,327 — — 36,327 36,326
Third-party commercial paper conduits 4,845 308 4,537 415 — 298 — 713 3,718 — — 3,718 353
Collateralized debt obligations (CDOs) 5,379 — 5,379 103 — — — 103 2,785 — — 2,785 21
Collateralized loan obligations (CLOs) 6,740 — 6,740 68 — — — 68 5,409 — — 5,409 120
Asset-based financing 17,571 1,421 16,150 5,641 — 5,596 11 11,248 19,612 — 1,279 18,333 5,221
Municipal securities tender
option bond trusts (TOBs) 17,047 8,105 8,942 — — 6,454 423 6,877 19,455 705 9,623 9,127 6,841
Municipal investments 12,002 178 11,824 675 2,929 1,478 — 5,082 10,906 — 11 10,895 2,370
Client intermediation 6,612 1,899 4,713 1,312 8 — — 1,320 8,607 — 2,749 5,858 881
Investment funds 3,741 259 3,482 2 82 66 19 169 93 — 39 54 10
Trust preferred securities 19,776 — 19,776 — 128 — — 128 19,345 — — 19,345 128
Other 5,085 1,412 3,673 467 32 119 80 698 7,380 1,808 1,838 3,734 446
Total $374,381 $ 98,409 $275,972 $11,387 $3,179 $23,640 $ 560 $38,766 $477,419 $346,295 $15,539 $ 115,585 $ 52,717
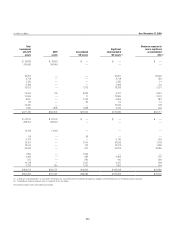
Citi Holdings
Credit card securitizations $ 33,606 $ 33,196 $ 410 $ — $ — $ — $ — $ — $ 42,274 $ 42,274 $ — $ — $ —
Mortgage securitizations (6) 308,504 308,504 — — —
U.S. agency-sponsored 207,729 — 207,729 2,701 — — 108 2,809
Non-agency-sponsored 22,274 2,727 19,547 160 — — — 160
Student loan securitizations 2,893 2,893 — — — — — — 14,343 14,343 — — —
Citi-administered asset-backed
commercial paper conduits (ABCP) — — — — — — — — 98 — 98 — —
Third-party commercial paper conduits 3,365 — 3,365 — — 252 — 252 5,776 — — 5,776 439
Collateralized debt obligations (CDOs) 8,452 755 7,697 189 — — 141 330 24,157 — 7,614 16,543 1,158
Collateralized loan obligations (CLOs) 12,234 — 12,234 1,754 — 29 401 2,184 13,515 — 142 13,373 1,658
Asset-based financing 22,756 136 22,620 8,626 3 300 — 8,929 52,598 — 370 52,228 18,385
Municipal securities tender
option bond trusts (TOBs) — — — — — — — — 1,999 — 1,999 — —
Municipal investments 4,652 — 4,652 71 200 136 — 407 5,364 — 882 4,482 375
Client intermediation 659 195 464 62 — — 345 407 675 — 230 445 396
Investment funds 1,961 627 1,334 — 70 45 — 115 10,178 — 1,037 9,141 268
Other 8,444 6,955 1,489 276 112 91 — 479 3,732 610 1,472 1,650 604
Total $329,025 $ 47,484 $281,541 $13,839 $ 385 $ 853 $ 995 $16,072 $483,213 $ 365,731 $ 13,844 $ 103,638 $ 23,283
Total Citigroup $703,406 $145,893 $557,513 $25,226 $ 3,564 $24,493 $1,555 $54,838 $960,632 $712,026 $29,383 $ 219,223 $ 76,000
(1) The definition of maximum exposure to loss is included in the text that follows.
(2) Included in Citigroup’s December 31, 2010 Consolidated Balance Sheet.
(3) Not included in Citigroup’s December 31, 2010 Consolidated Balance Sheet.
(4) Due to the adoption of ASC 810, Consolidation (SFAS 167) on January 1, 2010, the previously disclosed assets of former QSPEs are now included in either the “Consolidated VIE / SPE assets” or the “Significant
unconsolidated VIE assets” columns for the December 31, 2010 period.
(5) A significant unconsolidated VIE is an entity where the Company has any variable interest considered to be significant, regardless of the likelihood of loss or the notional amount of exposure.
(6) A significant portion of the Company’s securitized mortgage portfolio was transferred from Citi Holdings to Citicorp during the first quarter of 2010.