Citibank 2010 Annual Report Download - page 53
Download and view the complete annual report
Please find page 53 of the 2010 Citibank annual report below. You can navigate through the pages in the report by either clicking on the pages listed below, or by using the keyword search tool below to find specific information within the annual report.-
 1
1 -
2
-
3
-
4
-
5
-
6
-
7
-
8
-
9
-
10
-
11
-
12
-
13
-
14
-
15
-
16
-
17
-
18
-
19
-
20
-
21
-
22
-
23
-
24
-
25
-
26
-
27
-
28
-
29
-
30
-
31
-
32
-
33
-
34
-
35
-
36
-
37
-
38
-
39
-
40
-
41
-
42
-
 43
43 -
 44
44 -
 45
45 -
 46
46 -
 47
47 -
 48
48 -
 49
49 -
 50
50 -
 51
51 -
 52
52 -
 53
53 -
 54
54 -
 55
55 -
 56
56 -
 57
57 -
 58
58 -
 59
59 -
 60
60 -
 61
61 -
 62
62 -
 63
63 -
64
-
65
-
66
-
67
-
68
-
69
-
70
-
71
-
72
-
73
-
74
-
75
-
76
-
77
-
78
-
79
-
80
-
81
-
82
-
83
-
84
-
85
-
86
-
87
-
88
-
89
-
90
-
91
-
92
-
93
-
94
-
95
-
96
-
97
-
98
-
99
-
100
-
101
-
102
-
103
-
104
-
105
-
106
-
107
-
108
-
109
-
110
-
111
-
112
-
113
-
114
-
115
-
116
-
117
-
118
-
119
-
120
-
121
-
122
-
123
-
124
-
125
-
126
-
127
-
128
-
129
-
130
-
131
-
132
-
133
-
134
-
135
-
136
-
137
-
138
-
139
-
140
-
141
-
142
-
143
-
144
-
145
-
146
-
147
-
148
-
149
-
150
-
151
-
152
-
153
-
154
-
155
-
156
-
157
-
158
-
159
-
160
-
161
-
162
-
163
-
164
-
165
-
166
-
167
-
168
-
169
-
170
-
171
-
172
-
173
-
174
-
175
-
176
-
177
-
178
-
179
-
180
-
181
-
182
-
183
-
184
-
185
-
186
-
187
-
188
-
189
-
190
-
191
-
192
-
193
-
194
-
195
-
196
-
197
-
198
-
199
-
200
-
201
-
202
-
203
-
204
-
205
-
206
-
207
-
208
-
209
-
210
-
211
-
212
-
213
-
214
-
215
-
216
-
217
-
218
-
219
-
220
-
221
-
222
-
223
-
224
-
225
-
226
-
227
-
228
-
229
-
230
-
231
-
232
-
233
-
234
-
235
-
236
-
237
-
238
-
239
-
240
-
241
-
242
-
243
-
244
-
245
-
246
-
247
-
248
-
249
-
250
-
251
-
252
-
253
-
254
-
255
-
256
-
257
-
258
-
259
-
260
-
261
-
262
-
263
-
264
-
265
-
266
-
267
-
268
-
269
-
270
-
271
-
272
-
273
-
274
-
275
-
276
-
277
-
278
-
279
-
280
-
281
-
282
-
283
-
284
-
285
-
286
-
287
-
288
-
289
-
290
-
291
-
292
-
293
-
294
-
295
-
296
-
297
-
298
-
299
-
300
-
301
-
302
-
303
-
304
-
305
-
306
-
307
-
308
-
309
-
310
-
311
-
312
 |
 |

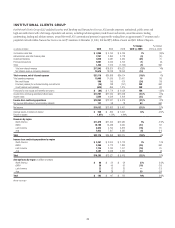
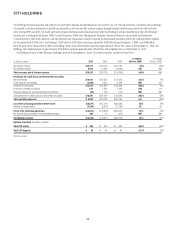
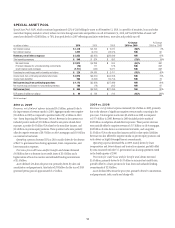
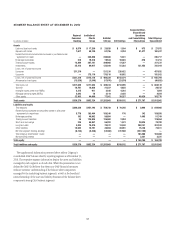
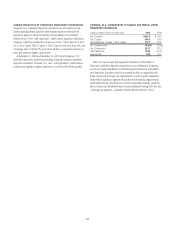
51
The following table provides details of the composition of SAP assets as of December 31, 2010.
Assets within Special Asset Pool as of December 31, 2010
In billions of dollars
Carrying value
of assets Face value
Carrying value as % of
face value
Securities in available-for-sale (AFS)
Corporates $ 5.5 $ 5.6 98%
Prime and non-U.S. mortgage-backed securities (MBS) 1.4 1.7 83
Auction rate securities (ARS) 2.0 2.5 80
Other securities (1) 0.2 0.2 73
Total securities in AFS $ 9.1 $10.0 89%
Securities in held-to-maturity (HTM)
Prime and non-U.S. MBS $ 8.0 $ 9.9 81%
Alt-A mortgages 8.8 17.1 52
Corporates 6.1 6.7 90
ARS 0.9 1.1 79
Other securities (2) 3.1 3.9 77
Total securities in HTM $26.9 $38.8 69%
Loans, leases and letters of credit (LCs) in held-for-investment (HFI)/held-for-sale (HFS) (3)
Corporates $ 8.1 $ 9.0 89%
Commercial real estate (CRE) 3.6 3.7 97
Other (4) 1.7 2.1 83
Loan loss reserves (1.8) — NM
Total loans, leases and LCs in HFI/HFS $11.6 $14.8 78%
Mark to market
Subprime securities $ 0.2 $ 2.2 8%
Other securities (5) 7.3 24.0 30
Derivatives 4.6 NM NM
Loans, leases and LCs 2.4 3.4 71
Repurchase agreements 5.5 NM NM
Total mark to market $20.0 NM NM
Highly leveraged finance commitments $ 1.9 $ 2.6 74%
Equities (excludes ARS in AFS) 5.7 NM NM
Monolines 0.4 NM NM
Consumer and other (6) 4.8 NM NM
Total $80.4
(1) Includes $0.1 billion of CRE.
(2) Includes assets previously held by structured investment vehicles (SIVs) ($2.1 billion of asset-backed securities, collateralized debt obligations (CDOs)/collateralized loan obligations (CLOs) and government bonds).
(3) HFS accounts for approximately $1.0 billion of the total.
(4) Includes $0.5 billion of subprime and $0.4 billion of leases.
(5) Includes $4.2 billion of ARS and $1.2 billion of Corporate securities.
(6) Includes $1.3 billion of small business banking and finance loans and $0.9 billion of personal loans.
Excludes Discontinued Operations.
Totals may not sum due to rounding.
NM Not meaningful
Note: Assets previously held by the Citi-advised SIVs have been allocated to the corresponding asset categories above. SAP had total CRE exposures of $6.1 billion at December 31, 2010, which included unfunded
commitments of $1.9 billion. SAP had total subprime assets of $1.7 billion at December 31, 2010, including assets of $0.8 billion of subprime-related direct exposures and $0.9 billion of trading account positions, which
includes securities purchased from CDO liquidations.