Citibank 2010 Annual Report Download - page 132
Download and view the complete annual report
Please find page 132 of the 2010 Citibank annual report below. You can navigate through the pages in the report by either clicking on the pages listed below, or by using the keyword search tool below to find specific information within the annual report.-
 1
1 -
2
-
3
-
4
-
5
-
6
-
7
-
8
-
9
-
10
-
11
-
12
-
13
-
14
-
15
-
16
-
17
-
18
-
19
-
20
-
21
-
22
-
23
-
24
-
25
-
26
-
27
-
28
-
29
-
30
-
31
-
32
-
33
-
34
-
35
-
36
-
37
-
38
-
39
-
40
-
41
-
42
-
43
-
44
-
45
-
46
-
47
-
48
-
49
-
50
-
51
-
52
-
53
-
54
-
55
-
56
-
57
-
58
-
59
-
60
-
61
-
62
-
63
-
64
-
65
-
66
-
67
-
68
-
69
-
70
-
71
-
72
-
73
-
74
-
75
-
76
-
77
-
78
-
79
-
80
-
81
-
82
-
83
-
84
-
85
-
86
-
87
-
88
-
89
-
90
-
91
-
92
-
93
-
94
-
95
-
96
-
97
-
98
-
99
-
100
-
101
-
102
-
103
-
104
-
105
-
106
-
107
-
108
-
109
-
110
-
111
-
112
-
113
-
114
-
115
-
116
-
117
-
118
-
119
-
120
-
121
-
 122
122 -
 123
123 -
 124
124 -
 125
125 -
 126
126 -
 127
127 -
 128
128 -
 129
129 -
 130
130 -
 131
131 -
 132
132 -
 133
133 -
 134
134 -
 135
135 -
 136
136 -
 137
137 -
 138
138 -
 139
139 -
 140
140 -
 141
141 -
 142
142 -
143
-
144
-
145
-
146
-
147
-
148
-
149
-
150
-
151
-
152
-
153
-
154
-
155
-
156
-
157
-
158
-
159
-
160
-
161
-
162
-
163
-
164
-
165
-
166
-
167
-
168
-
169
-
170
-
171
-
172
-
173
-
174
-
175
-
176
-
177
-
178
-
179
-
180
-
181
-
182
-
183
-
184
-
185
-
186
-
187
-
188
-
189
-
190
-
191
-
192
-
193
-
194
-
195
-
196
-
197
-
198
-
199
-
200
-
201
-
202
-
203
-
204
-
205
-
206
-
207
-
208
-
209
-
210
-
211
-
212
-
213
-
214
-
215
-
216
-
217
-
218
-
219
-
220
-
221
-
222
-
223
-
224
-
225
-
226
-
227
-
228
-
229
-
230
-
231
-
232
-
233
-
234
-
235
-
236
-
237
-
238
-
239
-
240
-
241
-
242
-
243
-
244
-
245
-
246
-
247
-
248
-
249
-
250
-
251
-
252
-
253
-
254
-
255
-
256
-
257
-
258
-
259
-
260
-
261
-
262
-
263
-
264
-
265
-
266
-
267
-
268
-
269
-
270
-
271
-
272
-
273
-
274
-
275
-
276
-
277
-
278
-
279
-
280
-
281
-
282
-
283
-
284
-
285
-
286
-
287
-
288
-
289
-
290
-
291
-
292
-
293
-
294
-
295
-
296
-
297
-
298
-
299
-
300
-
301
-
302
-
303
-
304
-
305
-
306
-
307
-
308
-
309
-
310
-
311
-
312
 |
 |

130
DERIVATIVES
See Note 23 to the Consolidated Financial Statements for a discussion
and disclosures related to Citigroup’s derivative activities. The following
discussions relate to the Derivative Obligor Information, the Fair Valuation
for Derivatives and Credit Derivatives activities.
Fair Valuation Adjustments for Derivatives
The fair value adjustments applied by Citigroup to its derivative carrying
values consist of the following items:
Liquidity adjustments are applied to items in Level 2 or Level 3 of the •
fair-value hierarchy (see Note 25 to the Consolidated Financial Statements
for more details) to ensure that the fair value reflects the price at which
the entire position could be liquidated. The liquidity reserve is based on
the bid/offer spread for an instrument, adjusted to take into account the
size of the position.
Credit valuation adjustments (CVA) are applied to over-the-counter •
derivative instruments, in which the base valuation generally discounts
expected cash flows using LIBOR interest rate curves. Because not all
counterparties have the same credit risk as that implied by the relevant
LIBOR curve, a CVA is necessary to incorporate the market view of both
counterparty credit risk and Citi’s own credit risk in the valuation.
Citigroup CVA methodology comprises two steps. First, the exposure
profile for each counterparty is determined using the terms of all individual
derivative positions and a Monte Carlo simulation or other quantitative
analysis to generate a series of expected cash flows at future points in time.
The calculation of this exposure profile considers the effect of credit risk
mitigants, including pledged cash or other collateral and any legal right
of offset that exists with a counterparty through arrangements such as
netting agreements. Individual derivative contracts that are subject to an
enforceable master netting agreement with a counterparty are aggregated
for this purpose, since it is those aggregate net cash flows that are subject to
nonperformance risk. This process identifies specific, point-in-time future
cash flows that are subject to nonperformance risk, rather than using the
current recognized net asset or liability as a basis to measure the CVA.
Second, market-based views of default probabilities derived from observed
credit spreads in the credit default swap market are applied to the expected
future cash flows determined in step one. Own-credit CVA is determined
using Citi-specific credit default swap (CDS) spreads for the relevant tenor.
Generally, counterparty CVA is determined using CDS spread indices for each
credit rating and tenor. For certain identified facilities where individual
analysis is practicable (for example, exposures to monoline counterparties)
counterparty-specific CDS spreads are used.
The CVA adjustment is designed to incorporate a market view of the credit
risk inherent in the derivative portfolio. However, most derivative instruments
are negotiated bilateral contracts and are not commonly transferred to
third parties. Derivative instruments are normally settled contractually or,
if terminated early, are terminated at a value negotiated bilaterally between
the counterparties. Therefore, the CVA (both counterparty and own-credit)
may not be realized upon a settlement or termination in the normal course
of business. In addition, all or a portion of the credit valuation adjustments
may be reversed or otherwise adjusted in future periods in the event of
changes in the credit risk of Citi or its counterparties, or changes in the credit
mitigants (collateral and netting agreements) associated with the derivative
instruments.
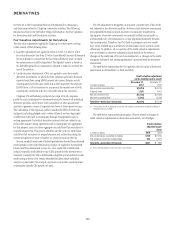
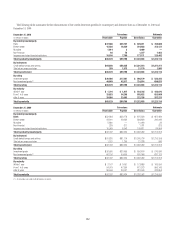
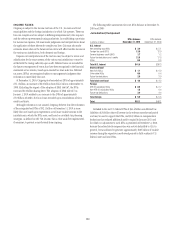
The table below summarizes the CVA applied to the fair value of derivative
instruments as of December 31, 2010 and 2009.
Credit valuation adjustment
contra-liability (contra-asset)
In millions of dollars
December 31,
2010
December 31,
2009
Non-monoline counterparties $(3,015) $(3,010)
Citigroup (own) 1,285 1,401
Net non-monoline CVA $(1,730) $ (1,609)
Monoline counterparties (1) (1,548) (5,580)
Total CVA—derivative instruments $(3,278) $(7,189)
(1) The reduction in CVA on derivative instruments with monoline counterparties includes $3.5 billion of
utilizations/releases in 2010.
The table below summarizes pretax gains (losses) related to changes in
credit valuation adjustments on derivative instruments, net of hedges:
Credit valuation
adjustment gain
(loss)
In millions of dollars 2010 2009 (1)
CVA on derivatives, excluding monolines $119 $ 2,189
CVA related to monoline counterparties 522 (1,301)
Total CVA—derivative instruments $641 $ 888
(1) Reclassified to conform to the current year’s presentation.