Citibank 2010 Annual Report Download - page 95
Download and view the complete annual report
Please find page 95 of the 2010 Citibank annual report below. You can navigate through the pages in the report by either clicking on the pages listed below, or by using the keyword search tool below to find specific information within the annual report.-
 1
1 -
2
-
3
-
4
-
5
-
6
-
7
-
8
-
9
-
10
-
11
-
12
-
13
-
14
-
15
-
16
-
17
-
18
-
19
-
20
-
21
-
22
-
23
-
24
-
25
-
26
-
27
-
28
-
29
-
30
-
31
-
32
-
33
-
34
-
35
-
36
-
37
-
38
-
39
-
40
-
41
-
42
-
43
-
44
-
45
-
46
-
47
-
48
-
49
-
50
-
51
-
52
-
53
-
54
-
55
-
56
-
57
-
58
-
59
-
60
-
61
-
62
-
63
-
64
-
65
-
66
-
67
-
68
-
69
-
70
-
71
-
72
-
73
-
74
-
75
-
76
-
77
-
78
-
79
-
80
-
81
-
82
-
83
-
84
-
 85
85 -
 86
86 -
 87
87 -
 88
88 -
 89
89 -
 90
90 -
 91
91 -
 92
92 -
 93
93 -
 94
94 -
 95
95 -
 96
96 -
 97
97 -
 98
98 -
 99
99 -
 100
100 -
 101
101 -
 102
102 -
 103
103 -
 104
104 -
 105
105 -
106
-
107
-
108
-
109
-
110
-
111
-
112
-
113
-
114
-
115
-
116
-
117
-
118
-
119
-
120
-
121
-
122
-
123
-
124
-
125
-
126
-
127
-
128
-
129
-
130
-
131
-
132
-
133
-
134
-
135
-
136
-
137
-
138
-
139
-
140
-
141
-
142
-
143
-
144
-
145
-
146
-
147
-
148
-
149
-
150
-
151
-
152
-
153
-
154
-
155
-
156
-
157
-
158
-
159
-
160
-
161
-
162
-
163
-
164
-
165
-
166
-
167
-
168
-
169
-
170
-
171
-
172
-
173
-
174
-
175
-
176
-
177
-
178
-
179
-
180
-
181
-
182
-
183
-
184
-
185
-
186
-
187
-
188
-
189
-
190
-
191
-
192
-
193
-
194
-
195
-
196
-
197
-
198
-
199
-
200
-
201
-
202
-
203
-
204
-
205
-
206
-
207
-
208
-
209
-
210
-
211
-
212
-
213
-
214
-
215
-
216
-
217
-
218
-
219
-
220
-
221
-
222
-
223
-
224
-
225
-
226
-
227
-
228
-
229
-
230
-
231
-
232
-
233
-
234
-
235
-
236
-
237
-
238
-
239
-
240
-
241
-
242
-
243
-
244
-
245
-
246
-
247
-
248
-
249
-
250
-
251
-
252
-
253
-
254
-
255
-
256
-
257
-
258
-
259
-
260
-
261
-
262
-
263
-
264
-
265
-
266
-
267
-
268
-
269
-
270
-
271
-
272
-
273
-
274
-
275
-
276
-
277
-
278
-
279
-
280
-
281
-
282
-
283
-
284
-
285
-
286
-
287
-
288
-
289
-
290
-
291
-
292
-
293
-
294
-
295
-
296
-
297
-
298
-
299
-
300
-
301
-
302
-
303
-
304
-
305
-
306
-
307
-
308
-
309
-
310
-
311
-
312
 |
 |
93
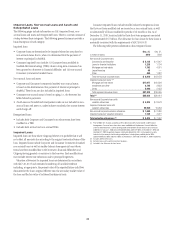
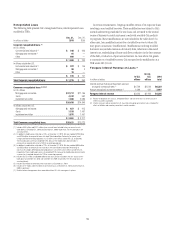
Citi’s first mortgage portfolio includes $9.3 billion of loans with FHA or VA
guarantees. These portfolios consist of loans originated to low-to-moderate-
income borrowers with lower FICO (Fair Isaac Corporation) scores and
generally have higher loan-to-value ratios (LTVs). Losses on FHA loans are
borne by the sponsoring agency, provided that the insurance has not been
breached as a result of an origination defect. The VA establishes a loan-level
loss cap, beyond which Citi is liable for loss. FHA and VA loans have high
delinquency rates but, given the guarantees, Citi has experienced negligible
credit losses on these loans. The first mortgage portfolio also includes
$1.8 billion of loans with LTVs above 80%, which have insurance through
private mortgage insurance (PMI) companies, and $1.7 billion of loans
subject to long-term standby commitments (LTSC), with U.S. government
sponsored entities (GSEs), for which Citi has limited exposure to credit losses.
Citi’s second mortgage portfolio also includes $0.6 billion of loans subject to
LTSCs with GSEs, for which Citi has limited exposure to credit losses. Citi’s
allowance for loan loss calculations take into consideration the impact of
these guarantees.
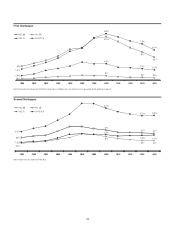
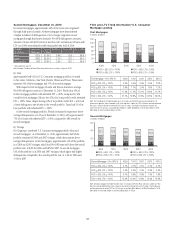
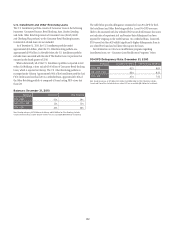
Consumer Mortgage Quarterly Trends—Delinquencies and
Net Credit Losses
The following charts detail the quarterly trends in delinquencies and
net credit losses for Citi’s first and second Consumer mortgage portfolios
in North America. As set forth in the charts below, net credit losses and
delinquencies of 90 days or more in both first and second mortgages
continued to improve during the fourth quarter of 2010. Citi continued to
manage down its first and second mortgage portfolios in Citi Holdings during
2010. The first mortgage portfolio in Citi Holdings was reduced by almost
20% to $80 billion, and the second mortgage portfolio by 14% to $44 billion,
each as of December 31, 2010. These reductions were achieved through a
combination of sales (first mortgages only), run-off and net credit losses.
For first mortgages, delinquencies of 90 days or more were down for the
fourth consecutive quarter. The sequential decline in delinquencies was due
entirely to asset sales and trial modifications converting into permanent
modifications, without which the delinquencies in first mortgages would
have been up slightly. During the full year 2010, Citi sold $4.8 billion in
delinquent mortgages. In addition, as of December 31, 2010, Citi had
converted a total of approximately $4.8 billion of trial modifications under
Citi’s loan modification programs to permanent modifications, more than
three-quarters of which were pursuant to the U.S. Treasury’s Home Affordable
Modification Program (HAMP).
For second mortgages, the net credit loss and delinquencies of 90 days or
more were relatively stable compared to the third quarter of 2010.
For information on Citi’s loan modification programs regarding
mortgages, see “Consumer Loan Modification Programs” below.