Citibank 2010 Annual Report Download - page 298
Download and view the complete annual report
Please find page 298 of the 2010 Citibank annual report below. You can navigate through the pages in the report by either clicking on the pages listed below, or by using the keyword search tool below to find specific information within the annual report.-
 1
1 -
2
-
3
-
4
-
5
-
6
-
7
-
8
-
9
-
10
-
11
-
12
-
13
-
14
-
15
-
16
-
17
-
18
-
19
-
20
-
21
-
22
-
23
-
24
-
25
-
26
-
27
-
28
-
29
-
30
-
31
-
32
-
33
-
34
-
35
-
36
-
37
-
38
-
39
-
40
-
41
-
42
-
43
-
44
-
45
-
46
-
47
-
48
-
49
-
50
-
51
-
52
-
53
-
54
-
55
-
56
-
57
-
58
-
59
-
60
-
61
-
62
-
63
-
64
-
65
-
66
-
67
-
68
-
69
-
70
-
71
-
72
-
73
-
74
-
75
-
76
-
77
-
78
-
79
-
80
-
81
-
82
-
83
-
84
-
85
-
86
-
87
-
88
-
89
-
90
-
91
-
92
-
93
-
94
-
95
-
96
-
97
-
98
-
99
-
100
-
101
-
102
-
103
-
104
-
105
-
106
-
107
-
108
-
109
-
110
-
111
-
112
-
113
-
114
-
115
-
116
-
117
-
118
-
119
-
120
-
121
-
122
-
123
-
124
-
125
-
126
-
127
-
128
-
129
-
130
-
131
-
132
-
133
-
134
-
135
-
136
-
137
-
138
-
139
-
140
-
141
-
142
-
143
-
144
-
145
-
146
-
147
-
148
-
149
-
150
-
151
-
152
-
153
-
154
-
155
-
156
-
157
-
158
-
159
-
160
-
161
-
162
-
163
-
164
-
165
-
166
-
167
-
168
-
169
-
170
-
171
-
172
-
173
-
174
-
175
-
176
-
177
-
178
-
179
-
180
-
181
-
182
-
183
-
184
-
185
-
186
-
187
-
188
-
189
-
190
-
191
-
192
-
193
-
194
-
195
-
196
-
197
-
198
-
199
-
200
-
201
-
202
-
203
-
204
-
205
-
206
-
207
-
208
-
209
-
210
-
211
-
212
-
213
-
214
-
215
-
216
-
217
-
218
-
219
-
220
-
221
-
222
-
223
-
224
-
225
-
226
-
227
-
228
-
229
-
230
-
231
-
232
-
233
-
234
-
235
-
236
-
237
-
238
-
239
-
240
-
241
-
242
-
243
-
244
-
245
-
246
-
247
-
248
-
249
-
250
-
251
-
252
-
253
-
254
-
255
-
256
-
257
-
258
-
259
-
260
-
261
-
262
-
263
-
264
-
265
-
266
-
267
-
268
-
269
-
270
-
271
-
272
-
273
-
274
-
275
-
276
-
277
-
278
-
279
-
280
-
281
-
282
-
283
-
284
-
285
-
286
-
287
-
 288
288 -
 289
289 -
 290
290 -
 291
291 -
 292
292 -
 293
293 -
 294
294 -
 295
295 -
 296
296 -
 297
297 -
 298
298 -
 299
299 -
 300
300 -
 301
301 -
 302
302 -
 303
303 -
 304
304 -
 305
305 -
 306
306 -
 307
307 -
 308
308 -
309
-
310
-
311
-
312
 |
 |

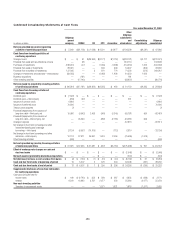
296
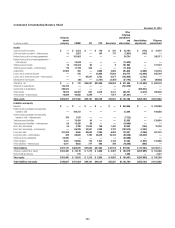
Condensed Consolidating Statements of Cash Flows
Year ended December 31, 2010
In millions of dollars
Citigroup
parent
company CGMHI CFI CCC Associates
Other
Citigroup
subsidiaries
and
eliminations
Consolidating
adjustments
Citigroup
consolidated
Net cash provided by (used in) operating
activities of continuing operations $ 8,756 $ 28,432 $ 326 $ 3,084 $ 3,767 $ (5,595) $ (3,084) $ 35,686
Cash flows from investing activities of
continuing operations
Change in loans $ — $ 27 $ 34,004 $ 3,098 $ 3,935 $ 22,764 $ (3,098) $ 60,730
Proceeds from sales and securitizations of loans — 103 — 1,865 1,898 7,917 (1,865) 9,918
Purchases of investments (31,346) (11) — (518) (521) (374,168) 518 (406,046)
Proceeds from sales of investments 6,029 27 — 557 669 176,963 (557) 183,688
Proceeds from maturities of investments 16,834 — — 356 365 172,615 (356) 189,814
Changes in investments and advances—intercompany 13,363 3,503 — (336) 744 (17,610) 336 —
Business acquisitions (20) — — — — 20 — —
Other investing activities — (14,746) — (22) (22) 20,001 22 5,233
Net cash provided by (used in) investing activities
of continuing operations $ 4,860 $(11,097) $ 34,004 $ 5,000 $ 7,068 $ 8,502 $ (5,000) $ 43,337
Cash flows from financing activities of
continuing operations
Dividends paid $ (9) $ — $ — $ — $ — $ — $ — $ (9)
Dividends paid—intercompany — (7,045) (1,500) — — 8,545 — —
Treasury stock acquired (6) — — — — — — (6)
Proceeds/(repayments) from issuance of
long-term debt—third-party, net (8,339) (3,044) (5,326) 1,503 61 (25,585) (1,503) (42,233)
Proceeds/(repayments) from issuance of
long-term debt—intercompany, net — (2,208) — (11,261) 18,946 (16,738) 11,261 —
Change in deposits — — — — — 9,065 — 9,065
Net change in short-term borrowings and other
investment banking and brokerage borrowings—
third-party 11 (2,297) 954 750 1,112 (46,969) (750) (47,189)
Net change in short-term borrowings and other
advances—intercompany (8,211) (2,468) (28,459) 904 (31,021) 70,159 (904) —
Other financing activities 2,944 — — — — — — 2,944
Net cash (used in) provided by financing activities
of continuing operations $(13,610) $(17,062) $(34,331) $ (8,104) $(10,902) $ (1,523) $ 8,104 $ (77,428)
Effect of exchange rate changes on cash and
due from banks $ — $ — $ — $ — $ — $ 691 $ — $ 691
Net cash provided by (used in) discontinued
operations — — — — — 214 — 214
Net increase (decrease) in cash and due from banks $ 6 $ 273 $ (1) $ (20) $ (67) $ 2,289 $ 20 $ 2,500
Cash and due from banks at beginning of period 5 4,947 1 343 465 20,054 (343) 25,472
Cash and due from banks at end of period $ 11 $ 5,220 $ — $ 323 $ 398 $ 22,343 $ (323) $ 27,972
Supplemental disclosure of cash flow information
for continuing operations
Cash paid during the year for
Income taxes $ (507) $ 246 $ 348 $ (20) $ (5) $ 4,225 $ 20 $ 4,307
Interest 9,317 5,194 1,014 2,208 1,593 6,091 (2,208) 23,209
Non-cash investing activities
Transfers to repossessed assets — 222 — 1,274 1,336 1,037 (1,274) 2,595