Citibank 2010 Annual Report Download - page 154
Download and view the complete annual report
Please find page 154 of the 2010 Citibank annual report below. You can navigate through the pages in the report by either clicking on the pages listed below, or by using the keyword search tool below to find specific information within the annual report.-
 1
1 -
2
-
3
-
4
-
5
-
6
-
7
-
8
-
9
-
10
-
11
-
12
-
13
-
14
-
15
-
16
-
17
-
18
-
19
-
20
-
21
-
22
-
23
-
24
-
25
-
26
-
27
-
28
-
29
-
30
-
31
-
32
-
33
-
34
-
35
-
36
-
37
-
38
-
39
-
40
-
41
-
42
-
43
-
44
-
45
-
46
-
47
-
48
-
49
-
50
-
51
-
52
-
53
-
54
-
55
-
56
-
57
-
58
-
59
-
60
-
61
-
62
-
63
-
64
-
65
-
66
-
67
-
68
-
69
-
70
-
71
-
72
-
73
-
74
-
75
-
76
-
77
-
78
-
79
-
80
-
81
-
82
-
83
-
84
-
85
-
86
-
87
-
88
-
89
-
90
-
91
-
92
-
93
-
94
-
95
-
96
-
97
-
98
-
99
-
100
-
101
-
102
-
103
-
104
-
105
-
106
-
107
-
108
-
109
-
110
-
111
-
112
-
113
-
114
-
115
-
116
-
117
-
118
-
119
-
120
-
121
-
122
-
123
-
124
-
125
-
126
-
127
-
128
-
129
-
130
-
131
-
132
-
133
-
134
-
135
-
136
-
137
-
138
-
139
-
140
-
141
-
142
-
143
-
 144
144 -
 145
145 -
 146
146 -
 147
147 -
 148
148 -
 149
149 -
 150
150 -
 151
151 -
 152
152 -
 153
153 -
 154
154 -
 155
155 -
 156
156 -
 157
157 -
 158
158 -
 159
159 -
 160
160 -
 161
161 -
 162
162 -
 163
163 -
 164
164 -
165
-
166
-
167
-
168
-
169
-
170
-
171
-
172
-
173
-
174
-
175
-
176
-
177
-
178
-
179
-
180
-
181
-
182
-
183
-
184
-
185
-
186
-
187
-
188
-
189
-
190
-
191
-
192
-
193
-
194
-
195
-
196
-
197
-
198
-
199
-
200
-
201
-
202
-
203
-
204
-
205
-
206
-
207
-
208
-
209
-
210
-
211
-
212
-
213
-
214
-
215
-
216
-
217
-
218
-
219
-
220
-
221
-
222
-
223
-
224
-
225
-
226
-
227
-
228
-
229
-
230
-
231
-
232
-
233
-
234
-
235
-
236
-
237
-
238
-
239
-
240
-
241
-
242
-
243
-
244
-
245
-
246
-
247
-
248
-
249
-
250
-
251
-
252
-
253
-
254
-
255
-
256
-
257
-
258
-
259
-
260
-
261
-
262
-
263
-
264
-
265
-
266
-
267
-
268
-
269
-
270
-
271
-
272
-
273
-
274
-
275
-
276
-
277
-
278
-
279
-
280
-
281
-
282
-
283
-
284
-
285
-
286
-
287
-
288
-
289
-
290
-
291
-
292
-
293
-
294
-
295
-
296
-
297
-
298
-
299
-
300
-
301
-
302
-
303
-
304
-
305
-
306
-
307
-
308
-
309
-
310
-
311
-
312
 |
 |

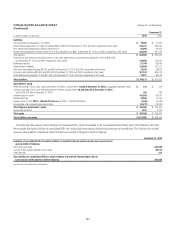
152
CONSOLIDATED BALANCE SHEET Citigroup Inc. and Subsidiaries
December 31,
In millions of dollars, except shares 2010 2009
Assets
Cash and due from banks (including segregated cash and other deposits) $ 27,972 $ 25,472
Deposits with banks 162,437 167,414
Federal funds sold and securities borrowed or purchased under agreements to resell (including $87,512 and $87,812
as of December 31, 2010 and 2009, respectively, at fair value) 246,717 222,022
Brokerage receivables 31,213 33,634
Trading account assets (including $117,554 and $111,219 pledged to creditors at December 31, 2010 and 2009, respectively) 317,272 342,773
Investments (including $12,546 and $15,154 pledged to creditors at December 31, 2010 and 2009, respectively, and
$281,174 and $246,429 at December 31, 2010 and 2009, respectively, at fair value) 318,164 306,119
Loans, net of unearned income
Consumer (including $1,745 and $34 as of December 31, 2010 and 2009, respectively, at fair value) 457,632 424,057
Corporate (including $2,627 and $1,405 at December 31, 2010 and 2009, respectively, at fair value) 191,162 167,447
Loans, net of unearned income $ 648,794 $ 591,504
Allowance for loan losses (40,655) (36,033)
Total loans, net $ 608,139 $ 555,471
Goodwill 26,152 25,392
Intangible assets (other than MSRs) 7,504 8,714
Mortgage servicing rights (MSRs) 4,554 6,530
Other assets (including $19,319 and $12,664 as of December 31, 2010 and 2009, respectively, at fair value) 163,778 163,105
Total assets $1,913,902 $1,856,646
The following table presents certain assets of consolidated variable interest entities (VIEs), which are included in the Consolidated Balance Sheet above. The assets
in the table below include only those assets that can be used to settle obligations of consolidated VIEs on the following page, and are in excess of those obligations.
December 31, 2010
Assets of consolidated VIEs that can only be used to settle obligations of consolidated VIEs
Cash and due from banks $ 799
Trading account assets 6,509
Investments 7,946
Loans, net of unearned income
Consumer (including $1,718 at fair value) 117,768
Corporate (including $425 at fair value) 23,537
Loans, net of unearned income $141,305
Allowance for loan losses (11,346)
Total loans, net $129,959
Other assets 680
Total assets of consolidated VIEs that can only be used to settle obligations of consolidated VIEs $145,893
Statement continues on the next page