Citibank 2010 Annual Report Download - page 46
Download and view the complete annual report
Please find page 46 of the 2010 Citibank annual report below. You can navigate through the pages in the report by either clicking on the pages listed below, or by using the keyword search tool below to find specific information within the annual report.-
 1
1 -
2
-
3
-
4
-
5
-
6
-
7
-
8
-
9
-
10
-
11
-
12
-
13
-
14
-
15
-
16
-
17
-
18
-
19
-
20
-
21
-
22
-
23
-
24
-
25
-
26
-
27
-
28
-
29
-
30
-
31
-
32
-
33
-
34
-
35
-
 36
36 -
 37
37 -
 38
38 -
 39
39 -
 40
40 -
 41
41 -
 42
42 -
 43
43 -
 44
44 -
 45
45 -
 46
46 -
 47
47 -
 48
48 -
 49
49 -
 50
50 -
 51
51 -
 52
52 -
 53
53 -
 54
54 -
 55
55 -
 56
56 -
57
-
58
-
59
-
60
-
61
-
62
-
63
-
64
-
65
-
66
-
67
-
68
-
69
-
70
-
71
-
72
-
73
-
74
-
75
-
76
-
77
-
78
-
79
-
80
-
81
-
82
-
83
-
84
-
85
-
86
-
87
-
88
-
89
-
90
-
91
-
92
-
93
-
94
-
95
-
96
-
97
-
98
-
99
-
100
-
101
-
102
-
103
-
104
-
105
-
106
-
107
-
108
-
109
-
110
-
111
-
112
-
113
-
114
-
115
-
116
-
117
-
118
-
119
-
120
-
121
-
122
-
123
-
124
-
125
-
126
-
127
-
128
-
129
-
130
-
131
-
132
-
133
-
134
-
135
-
136
-
137
-
138
-
139
-
140
-
141
-
142
-
143
-
144
-
145
-
146
-
147
-
148
-
149
-
150
-
151
-
152
-
153
-
154
-
155
-
156
-
157
-
158
-
159
-
160
-
161
-
162
-
163
-
164
-
165
-
166
-
167
-
168
-
169
-
170
-
171
-
172
-
173
-
174
-
175
-
176
-
177
-
178
-
179
-
180
-
181
-
182
-
183
-
184
-
185
-
186
-
187
-
188
-
189
-
190
-
191
-
192
-
193
-
194
-
195
-
196
-
197
-
198
-
199
-
200
-
201
-
202
-
203
-
204
-
205
-
206
-
207
-
208
-
209
-
210
-
211
-
212
-
213
-
214
-
215
-
216
-
217
-
218
-
219
-
220
-
221
-
222
-
223
-
224
-
225
-
226
-
227
-
228
-
229
-
230
-
231
-
232
-
233
-
234
-
235
-
236
-
237
-
238
-
239
-
240
-
241
-
242
-
243
-
244
-
245
-
246
-
247
-
248
-
249
-
250
-
251
-
252
-
253
-
254
-
255
-
256
-
257
-
258
-
259
-
260
-
261
-
262
-
263
-
264
-
265
-
266
-
267
-
268
-
269
-
270
-
271
-
272
-
273
-
274
-
275
-
276
-
277
-
278
-
279
-
280
-
281
-
282
-
283
-
284
-
285
-
286
-
287
-
288
-
289
-
290
-
291
-
292
-
293
-
294
-
295
-
296
-
297
-
298
-
299
-
300
-
301
-
302
-
303
-
304
-
305
-
306
-
307
-
308
-
309
-
310
-
311
-
312
 |
 |
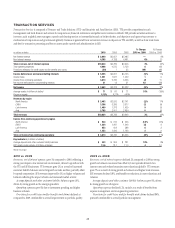
44
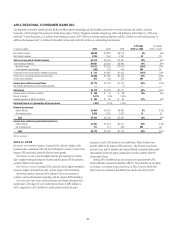
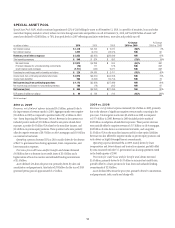
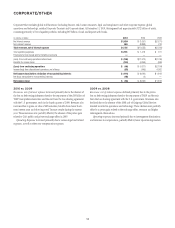
2010 vs. 2009
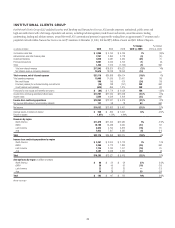
Revenues, net of interest expense of $23.1 billion decreased 15%, or
$4.0 billion, from $27.1 billion in 2009, which was a particularly strong
year driven by robust fixed income markets and higher client activity levels
in investment banking, especially in the first half of that year. The decline
in revenue was mainly due to fixed income markets, which decreased from
$21.0 billion to $14.3 billion (excluding CVA, net of hedges, of negative
$0.2 billion and positive $0.3 billion in the current year and prior year,
respectively). This decrease primarily reflected weaker results in rates and
currencies, credit products and securitized products, due to an overall
weaker market environment. Equity markets declined from $5.4 billion
to $3.7 billion (excluding CVA, net of hedges, of negative $0.2 billion and
negative $2.2 billion in the current year and prior year, respectively), driven
by lower trading revenues linked to the derivatives business and principal
positions. Investment banking revenues declined from $4.8 billion to
$3.8 billion, reflecting lower levels of market activity in debt and equity
underwriting. The declines were partially offset by an increase in lending
revenues and CVA. Lending revenues increased from negative $2.5 billion to
positive $0.9 billion, mainly driven by a reduction in losses on credit default
swap hedges. CVA increased $1.6 billion to negative $0.4 billion, mainly due
to a larger narrowing of Citigroup spreads in 2009 compared to 2010.
Operating expenses increased 11%, or $1.5 billion. Excluding the 2010
U.K. bonus tax impact and litigation reserve releases in 2010 and 2009,
operating expenses increased 8%, or $1.0 billion, mainly as a result of higher
compensation and transaction costs.
Provisions for loan losses and for benefits and claims decreased by
$1.8 billion, to negative $25 million, mainly due to credit reserve releases
and lower net credit losses as the result of an improvement in the credit
environment during 2010.
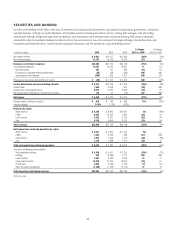
2009 vs. 2008
Revenues, net of interest expense of $27.1 billion increased 10%, or
$2.4 billion, from $24.7 billion, as markets began to recover in the early
part of 2009, bringing back higher levels of volume activity and higher
levels of liquidity, which began to decline again in the third quarter of
2009. The growth in revenue was driven mainly by an $8.1 billion increase
to $21.0 billion in fixed income markets (excluding CVA, net of hedges, of
positive $0.3 billion and positive $0.7 billion in 2009 and 2008, respectively),
reflecting strong trading opportunities across all asset classes in the first half
of 2009. Equity markets doubled from $2.7 billion to $5.4 billion (excluding
CVA, net of hedges, of negative $2.2 billion and positive $0.1 billion in 2009
and 2008, respectively), with growth being driven by derivatives, convertibles,
and equity trading. Investment banking revenues grew $1.5 billion, from
$3.3 billion to $4.8 billion, primarily from increases in debt and equity
underwriting activities reflecting higher transaction volumes from depressed
2008 levels. These increases were partially offset by decreases in lending
revenues and CVA. Lending revenues decreased by $7.3 billion, from
$4.8 billion to negative $2.5 billion, primarily from losses on credit default
swap hedges. CVA decreased from $0.9 billion to negative $2.0 billion, mainly
due to the narrowing of Citigroup spreads throughout 2009.
Operating expenses decreased 17%, or $2.8 billion. Excluding the
2008 repositioning and restructuring charges and a 2009 litigation reserve
release, operating expenses declined 9%, or $1.4 billion, mainly as a result of
headcount reductions and benefits from expense management.
Provisions for loan losses and for benefits and claims decreased 12%,
or $232 million, to $1.8 billion, mainly due to lower credit reserve builds and
net credit losses, due to an improved credit environment, particularly in the
latter part of 2009.