Citibank 2010 Annual Report Download - page 226
Download and view the complete annual report
Please find page 226 of the 2010 Citibank annual report below. You can navigate through the pages in the report by either clicking on the pages listed below, or by using the keyword search tool below to find specific information within the annual report.-
 1
1 -
2
-
3
-
4
-
5
-
6
-
7
-
8
-
9
-
10
-
11
-
12
-
13
-
14
-
15
-
16
-
17
-
18
-
19
-
20
-
21
-
22
-
23
-
24
-
25
-
26
-
27
-
28
-
29
-
30
-
31
-
32
-
33
-
34
-
35
-
36
-
37
-
38
-
39
-
40
-
41
-
42
-
43
-
44
-
45
-
46
-
47
-
48
-
49
-
50
-
51
-
52
-
53
-
54
-
55
-
56
-
57
-
58
-
59
-
60
-
61
-
62
-
63
-
64
-
65
-
66
-
67
-
68
-
69
-
70
-
71
-
72
-
73
-
74
-
75
-
76
-
77
-
78
-
79
-
80
-
81
-
82
-
83
-
84
-
85
-
86
-
87
-
88
-
89
-
90
-
91
-
92
-
93
-
94
-
95
-
96
-
97
-
98
-
99
-
100
-
101
-
102
-
103
-
104
-
105
-
106
-
107
-
108
-
109
-
110
-
111
-
112
-
113
-
114
-
115
-
116
-
117
-
118
-
119
-
120
-
121
-
122
-
123
-
124
-
125
-
126
-
127
-
128
-
129
-
130
-
131
-
132
-
133
-
134
-
135
-
136
-
137
-
138
-
139
-
140
-
141
-
142
-
143
-
144
-
145
-
146
-
147
-
148
-
149
-
150
-
151
-
152
-
153
-
154
-
155
-
156
-
157
-
158
-
159
-
160
-
161
-
162
-
163
-
164
-
165
-
166
-
167
-
168
-
169
-
170
-
171
-
172
-
173
-
174
-
175
-
176
-
177
-
178
-
179
-
180
-
181
-
182
-
183
-
184
-
185
-
186
-
187
-
188
-
189
-
190
-
191
-
192
-
193
-
194
-
195
-
196
-
197
-
198
-
199
-
200
-
201
-
202
-
203
-
204
-
205
-
206
-
207
-
208
-
209
-
210
-
211
-
212
-
213
-
214
-
215
-
 216
216 -
 217
217 -
 218
218 -
 219
219 -
 220
220 -
 221
221 -
 222
222 -
 223
223 -
 224
224 -
 225
225 -
 226
226 -
 227
227 -
 228
228 -
 229
229 -
 230
230 -
 231
231 -
 232
232 -
 233
233 -
 234
234 -
 235
235 -
 236
236 -
237
-
238
-
239
-
240
-
241
-
242
-
243
-
244
-
245
-
246
-
247
-
248
-
249
-
250
-
251
-
252
-
253
-
254
-
255
-
256
-
257
-
258
-
259
-
260
-
261
-
262
-
263
-
264
-
265
-
266
-
267
-
268
-
269
-
270
-
271
-
272
-
273
-
274
-
275
-
276
-
277
-
278
-
279
-
280
-
281
-
282
-
283
-
284
-
285
-
286
-
287
-
288
-
289
-
290
-
291
-
292
-
293
-
294
-
295
-
296
-
297
-
298
-
299
-
300
-
301
-
302
-
303
-
304
-
305
-
306
-
307
-
308
-
309
-
310
-
311
-
312
 |
 |

224
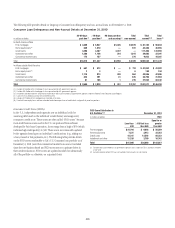
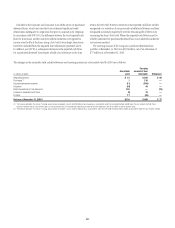
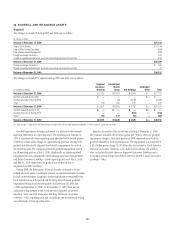
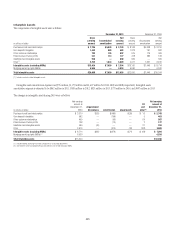
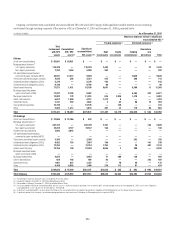
The following table shows reporting units with goodwill balances as
of December 31, 2010, and the excess of fair value as a percentage over
allocated book value as of the annual impairment test.
In millions of dollars
Reporting unit (1)
Fair value as a % of
allocated book value Goodwill
North America Regional Consumer Banking 170% $ 2,518
EMEA Regional Consumer Banking 168 338
Asia Regional Consumer Banking 344 6,045
Latin America Regional Consumer Banking 230 1,800
Securities and Banking 223 9,259
Transaction Services 1,716 1,567
Brokerage and Asset Management 151 65
Local Consumer Lending—Cards 121 4,560
(1) Local Consumer Lending—Other is excluded from the table as there is no goodwill allocated to it.
While no impairment was noted in step one of Citigroup’s Local
Consumer Lending—Cards reporting unit impairment test at July 1, 2010,
goodwill present in the reporting unit may be sensitive to further
deterioration as the valuation of the reporting unit is particularly dependent
upon economic conditions that affect consumer credit risk and behavior.
Citigroup engaged the services of an independent valuation specialist to assist
in the valuation of the reporting unit at July 1, 2010, using a combination
of the market approach and income approach consistent with the valuation
model used in past practice, which considered the impact of the penalty fee
provisions associated with the Credit Card Accountability Responsibility and
Disclosure Act of 2009 (CARD Act) that were implemented during 2010.
Under the market approach for valuing this reporting unit, the key
assumption is the selected price multiple. The selection of the multiple
considers the operating performance and financial condition of the Local
Consumer Lending—Cards operations as compared with those of a group
of selected publicly traded guideline companies and a group of selected
acquired companies. Among other factors, the level and expected growth in
return on tangible equity relative to those of the guideline companies and
guideline transactions is considered. Since the guideline company prices used
are on a minority interest basis, the selection of the multiple considers the
guideline acquisition prices, which reflect control rights and privileges, in
arriving at a multiple that reflects an appropriate control premium.
For the Local Consumer Lending—Cards valuation under the income
approach, the assumptions used as the basis for the model include cash
flows for the forecasted period, the assumptions embedded in arriving at
an estimation of the terminal value and the discount rate. The cash flows
for the forecasted period are estimated based on management’s most recent
projections available as of the testing date, giving consideration to targeted
equity capital requirements based on selected public guideline companies
for the reporting unit. In arriving at the terminal value for Local Consumer
Lending—Cards, using 2013 as the terminal year, the assumptions used
include a long-term growth rate and a price-to-tangible book multiple based
on selected public guideline companies for the reporting unit. The discount
rate is based on the reporting unit’s estimated cost of equity capital computed
under the capital asset pricing model.
Embedded in the key assumptions underlying the valuation model,
described above, is the inherent uncertainty regarding the possibility
that economic conditions may deteriorate or other events will occur that
will impact the business model for Local Consumer Lending—Cards.
While there is inherent uncertainty embedded in the assumptions used in
developing management’s forecasts, the Company utilized a discount rate at
July 1, 2010 that it believes reflects the risk characteristics and uncertainty
specific to management’s forecasts and assumptions for the Local Consumer
Lending—Cards reporting unit.
Two primary categories of events exist—economic conditions in
the U.S. and regulatory actions—which, if they were to occur, could
negatively affect key assumptions used in the valuation of Local Consumer
Lending—Cards. Small deterioration in the assumptions used in the
valuations, in particular the discount-rate and growth-rate assumptions
used in the net income projections, could significantly affect Citigroup’s
impairment evaluation and, hence, results. If the future were to differ
adversely from management’s best estimate of key economic assumptions,
and associated cash flows were to decrease by a small margin, Citi could
potentially experience future material impairment charges with respect to
$4,560 million of goodwill remaining in the Local Consumer Lending—
Cards reporting unit. Any such charges, by themselves, would not negatively
affect Citi’s Tier 1 and Total Capital regulatory ratios, Tier 1 Common ratio,
its Tangible Common Equity or Citi’s liquidity position.