Citibank 2010 Annual Report Download - page 220
Download and view the complete annual report
Please find page 220 of the 2010 Citibank annual report below. You can navigate through the pages in the report by either clicking on the pages listed below, or by using the keyword search tool below to find specific information within the annual report.-
 1
1 -
2
-
3
-
4
-
5
-
6
-
7
-
8
-
9
-
10
-
11
-
12
-
13
-
14
-
15
-
16
-
17
-
18
-
19
-
20
-
21
-
22
-
23
-
24
-
25
-
26
-
27
-
28
-
29
-
30
-
31
-
32
-
33
-
34
-
35
-
36
-
37
-
38
-
39
-
40
-
41
-
42
-
43
-
44
-
45
-
46
-
47
-
48
-
49
-
50
-
51
-
52
-
53
-
54
-
55
-
56
-
57
-
58
-
59
-
60
-
61
-
62
-
63
-
64
-
65
-
66
-
67
-
68
-
69
-
70
-
71
-
72
-
73
-
74
-
75
-
76
-
77
-
78
-
79
-
80
-
81
-
82
-
83
-
84
-
85
-
86
-
87
-
88
-
89
-
90
-
91
-
92
-
93
-
94
-
95
-
96
-
97
-
98
-
99
-
100
-
101
-
102
-
103
-
104
-
105
-
106
-
107
-
108
-
109
-
110
-
111
-
112
-
113
-
114
-
115
-
116
-
117
-
118
-
119
-
120
-
121
-
122
-
123
-
124
-
125
-
126
-
127
-
128
-
129
-
130
-
131
-
132
-
133
-
134
-
135
-
136
-
137
-
138
-
139
-
140
-
141
-
142
-
143
-
144
-
145
-
146
-
147
-
148
-
149
-
150
-
151
-
152
-
153
-
154
-
155
-
156
-
157
-
158
-
159
-
160
-
161
-
162
-
163
-
164
-
165
-
166
-
167
-
168
-
169
-
170
-
171
-
172
-
173
-
174
-
175
-
176
-
177
-
178
-
179
-
180
-
181
-
182
-
183
-
184
-
185
-
186
-
187
-
188
-
189
-
190
-
191
-
192
-
193
-
194
-
195
-
196
-
197
-
198
-
199
-
200
-
201
-
202
-
203
-
204
-
205
-
206
-
207
-
208
-
209
-
 210
210 -
 211
211 -
 212
212 -
 213
213 -
 214
214 -
 215
215 -
 216
216 -
 217
217 -
 218
218 -
 219
219 -
 220
220 -
 221
221 -
 222
222 -
 223
223 -
 224
224 -
 225
225 -
 226
226 -
 227
227 -
 228
228 -
 229
229 -
 230
230 -
231
-
232
-
233
-
234
-
235
-
236
-
237
-
238
-
239
-
240
-
241
-
242
-
243
-
244
-
245
-
246
-
247
-
248
-
249
-
250
-
251
-
252
-
253
-
254
-
255
-
256
-
257
-
258
-
259
-
260
-
261
-
262
-
263
-
264
-
265
-
266
-
267
-
268
-
269
-
270
-
271
-
272
-
273
-
274
-
275
-
276
-
277
-
278
-
279
-
280
-
281
-
282
-
283
-
284
-
285
-
286
-
287
-
288
-
289
-
290
-
291
-
292
-
293
-
294
-
295
-
296
-
297
-
298
-
299
-
300
-
301
-
302
-
303
-
304
-
305
-
306
-
307
-
308
-
309
-
310
-
311
-
312
 |
 |

218
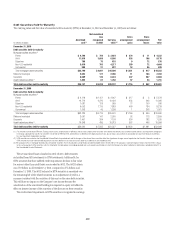
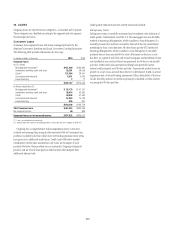
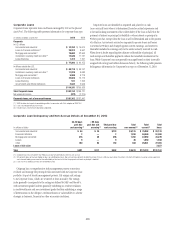
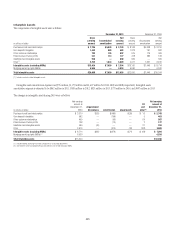
Corporate Loans
Corporate loans represent loans and leases managed by ICG or the Special
Asset Pool. The following table presents information by corporate loan type:
In millions of dollars at year end 2010 2009
Corporate
In U.S. offices
Commercial and industrial $ 14,334 $ 15,614
Loans to financial institutions (1) 29,813 6,947
Mortgage and real estate (2) 19,693 22,560
Installment, revolving credit and other (3) 12,640 17,737
Lease financing 1,413 1,297
$ 77,893 $ 64,155
In offices outside the U.S.
Commercial and industrial $ 69,718 $ 66,747
Installment, revolving credit and other (3) 11,829 9,683
Mortgage and real estate (2) 5,899 9,779
Loans to financial institutions 22,620 15,113
Lease financing 531 1,295
Governments and official institutions 3,644 2,949
$114,241 $105,566
Total Corporate loans $192,134 $169,721
Net unearned income (972) (2,274)
Corporate loans, net of unearned income $191,162 $167,447
(1) 2010 includes the impact of consolidating entities in connection with Citi’s adoption of SFAS 167.
(2) Loans secured primarily by real estate.
(3) Includes loans not otherwise separately categorized.
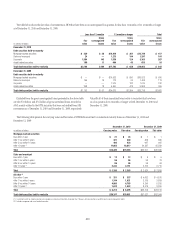
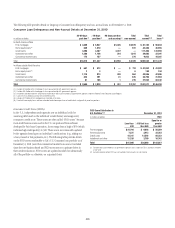
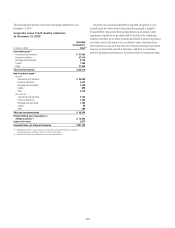
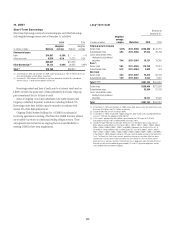
Corporate loans are identified as impaired and placed on a cash
(non-accrual) basis when it is determined, based on actual experience and
a forward-looking assessment of the collectability of the loan in full, that the
payment of interest or principal is doubtful or when interest or principal is
90 days past due, except when the loan is well collateralized and in the process
of collection. Any interest accrued on impaired corporate loans and leases
is reversed at 90 days and charged against current earnings, and interest is
thereafter included in earnings only to the extent actually received in cash.
When there is doubt regarding the ultimate collectability of principal, all
cash receipts are thereafter applied to reduce the recorded investment in the
loan. While Corporate loans are generally managed based on their internally
assigned risk rating (see further discussion below), the following table presents
delinquency information by Corporate loan type as of December 31, 2010:
Corporate Loan Delinquency and Non-Accrual Details at December 31, 2010
In millions of dollars
30–89 days
past due
and accruing (1)
≥ 90 days
past due and
accruing (1)
Total past due
and accruing
Total
non-accrual (2)
Total
current (3)
Total
loans
Commercial and industrial $ 94 $ 39 $133 $5,125 $ 76,862 $ 82,120
Financial institutions 2 — 2 1,258 50,648 51,908
Mortgage and real estate 376 20 396 1,782 22,892 25,070
Leases 9 — 9 45 1,890 1,944
Other 100 52 152 400 26,941 27,493
Loans at fair value 2,627
Total $ 581 $111 $692 $8,610 $179,233 $191,162
(1) Corporate loans that are greater than 90 days past due are generally classified as non-accrual.
(2) Citi generally does not manage Corporate loans on a delinquency basis. Non-accrual loans generally include those loans that are ≥ 90 days past due or those loans for which Citi believes, based on actual experience
and a forward-looking assessment of the collectability of the loan in full that the payment or interest or principal is doubtful.
(3) Loans less than 30 days past due are considered current.
Citigroup has a comprehensive risk management process to monitor,
evaluate and manage the principal risks associated with its Corporate loan
portfolio. As part of its risk management process, Citi assigns risk ratings
to its Corporate loans, which are reviewed at least annually. The ratings
scale generally corresponds to the ratings as defined by S&P and Moody’s,
with investment grade facilities generally exhibiting no evident weakness
in creditworthiness and non-investment grade facilities exhibiting a range
of deterioration in the obligor’s creditworthiness or vulnerability to adverse
changes in business, financial or other economic conditions.