Citibank 2010 Annual Report Download - page 68
Download and view the complete annual report
Please find page 68 of the 2010 Citibank annual report below. You can navigate through the pages in the report by either clicking on the pages listed below, or by using the keyword search tool below to find specific information within the annual report.-
 1
1 -
2
-
3
-
4
-
5
-
6
-
7
-
8
-
9
-
10
-
11
-
12
-
13
-
14
-
15
-
16
-
17
-
18
-
19
-
20
-
21
-
22
-
23
-
24
-
25
-
26
-
27
-
28
-
29
-
30
-
31
-
32
-
33
-
34
-
35
-
36
-
37
-
38
-
39
-
40
-
41
-
42
-
43
-
44
-
45
-
46
-
47
-
48
-
49
-
50
-
51
-
52
-
53
-
54
-
55
-
56
-
57
-
 58
58 -
 59
59 -
 60
60 -
 61
61 -
 62
62 -
 63
63 -
 64
64 -
 65
65 -
 66
66 -
 67
67 -
 68
68 -
 69
69 -
 70
70 -
 71
71 -
 72
72 -
 73
73 -
 74
74 -
 75
75 -
 76
76 -
 77
77 -
 78
78 -
79
-
80
-
81
-
82
-
83
-
84
-
85
-
86
-
87
-
88
-
89
-
90
-
91
-
92
-
93
-
94
-
95
-
96
-
97
-
98
-
99
-
100
-
101
-
102
-
103
-
104
-
105
-
106
-
107
-
108
-
109
-
110
-
111
-
112
-
113
-
114
-
115
-
116
-
117
-
118
-
119
-
120
-
121
-
122
-
123
-
124
-
125
-
126
-
127
-
128
-
129
-
130
-
131
-
132
-
133
-
134
-
135
-
136
-
137
-
138
-
139
-
140
-
141
-
142
-
143
-
144
-
145
-
146
-
147
-
148
-
149
-
150
-
151
-
152
-
153
-
154
-
155
-
156
-
157
-
158
-
159
-
160
-
161
-
162
-
163
-
164
-
165
-
166
-
167
-
168
-
169
-
170
-
171
-
172
-
173
-
174
-
175
-
176
-
177
-
178
-
179
-
180
-
181
-
182
-
183
-
184
-
185
-
186
-
187
-
188
-
189
-
190
-
191
-
192
-
193
-
194
-
195
-
196
-
197
-
198
-
199
-
200
-
201
-
202
-
203
-
204
-
205
-
206
-
207
-
208
-
209
-
210
-
211
-
212
-
213
-
214
-
215
-
216
-
217
-
218
-
219
-
220
-
221
-
222
-
223
-
224
-
225
-
226
-
227
-
228
-
229
-
230
-
231
-
232
-
233
-
234
-
235
-
236
-
237
-
238
-
239
-
240
-
241
-
242
-
243
-
244
-
245
-
246
-
247
-
248
-
249
-
250
-
251
-
252
-
253
-
254
-
255
-
256
-
257
-
258
-
259
-
260
-
261
-
262
-
263
-
264
-
265
-
266
-
267
-
268
-
269
-
270
-
271
-
272
-
273
-
274
-
275
-
276
-
277
-
278
-
279
-
280
-
281
-
282
-
283
-
284
-
285
-
286
-
287
-
288
-
289
-
290
-
291
-
292
-
293
-
294
-
295
-
296
-
297
-
298
-
299
-
300
-
301
-
302
-
303
-
304
-
305
-
306
-
307
-
308
-
309
-
310
-
311
-
312
 |
 |

66
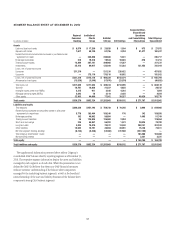
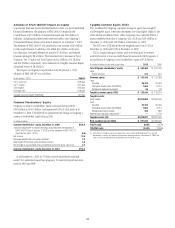
Absent the impact of consolidating securitizations under SFAS 166/167,
which increased long-term debt by approximately $70 billion, long-term debt
decreased by $53 billion from $364 billion for the year ended December 31,
2009 to $311 billion for the year ended December 31, 2010. The $53 billion
decrease (excluding securitizations) was driven by approximately $79 billion
of redemptions, maturities and business sales, which was partially offset by
approximately $29 billion of issuances during the year, with the remainder
primarily attributable to FX translation and fair value.
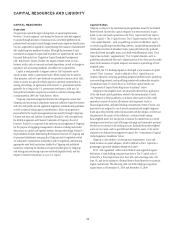
As noted in the table above, during 2010 Citi issued approximately one-
quarter of the amount of long-term debt it issued in 2009. Moreover, the
status of Citi’s liquidity resources and asset reductions in Citi Holdings during
2010 prompted less of a need to fully refinance long-term debt maturities.
Citi refinanced approximately $22 billion, or slightly more than half, of
the approximate $40 billion long-term debt that matured during 2010
(excluding local country, securitizations and FHLB).
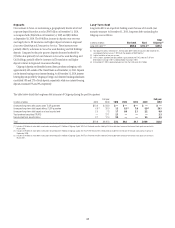
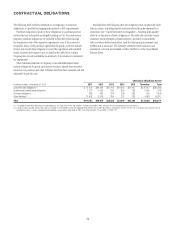
The table below shows the aggregate annual maturities of Citi’s long-term debt obligations:
Long-term debt maturities by year
In billions of dollars 2011 2012 2013 2014 2015 Thereafter Total
Senior/subordinated debt $41.5 $62.6 $27.0 $23.1 $15.5 $ 85.1 $254.8
Local country maturities 5.2 5.3 3.5 2.3 1.0 2.9 20.2
Trust preferred securities (TRUPS) — — — — — 18.1 18.1
Securitized debt and securitizations 12.3 26.3 4.2 6.6 5.4 15.3 70.1
FHLB borrowings 12.5 — 2.5 — — 3.0 18.0
Total long-term debt $71.5 $94.2 $37.2 $32.0 $21.9 $124.4 $381.2
Long-Term Debt Funding Outlook
Citi currently estimates its long-term debt maturing during 2011 to be
approximately $41 billion (which excludes maturities relating to local
country, securitizations and FHLB), of which approximately $20.3 billion is
TLGP debt. Given the current status of its liquidity resources and continued
reductions of assets in Citi Holdings, Citi currently expects to refinance
approximately $20 billion of long-term debt during 2011. Citi does not
expect to refinance its TLGP debt as it matures either during 2011 or 2012
(approximately $38 billion). Citi continues to review its funding and liquidity
needs, and may adjust its expected issuances due to market conditions or
regulatory requirements, among other factors.
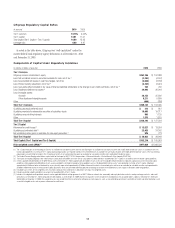
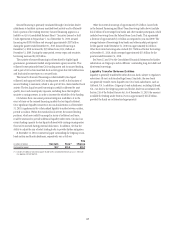
Federal funds purchased
and securities sold under
agreements to
repurchase (2)
Short-term borrowings (1)
Commercial paper (3) Other short-term borrowings
(4)
In billions of dollars 2010 2009 2008 2010 2009 2008 2010 2009 2008
Amounts outstanding at year end $189.6 $154.3 $205.3 $24.7 $10.2 $29.1 $ 54.1 $58.7 $ 97.6
Average outstanding during the year (5) 212.3 205.6 281.5 35.0 24.7 31.9 68.8 76.5 82.6
Maximum month-end outstanding 246.5 252.2 354.7 40.1 36.9 41.2 106.0 99.8 121.8
Weighted-average interest rate
During the year (5)(6) 1.32% 1.67% 4.00% 0.15% 0.99% 3.10% 1.26% 1.54% 1.70%
At year end (7) 0.99 0.85 2.22 0.35 0.34 1.67 0.40 0.66 2.40
(1) Original maturities of less than one year.
(2) Rates reflect prevailing local interest rates including inflationary effects and monetary correction in certain countries.
(3) Includes $15 billion of commercial paper related to VIEs consolidated effective January 1, 2010 with the adoption of SFAS 166/167.
(4) Other short-term borrowings include broker borrowings and borrowings from banks and other market participants.
(5) Excludes discontinued operations. While the annual average balance is primarily calculated from daily balances, in some cases, the average annual balance is calculated using a 13-point average composed of each of
the month-end balances during the year plus the prior year-end ending balance.
(6) Interest rates include the effects of risk management activities. See Notes 20 and 24 to the Consolidated Financial Statements.
(7) Based on contractual rates at year end.
Secured Financing and Short-Term Borrowings
As referenced above, Citi supplements its primary sources of funding with
short-term borrowings. Short-term borrowings generally include (i) secured
financing (securities loaned or sold under agreements to repurchase) and
(ii) short-term borrowings consisting of commercial paper and borrowings
from banks and other market participants. As required by SEC rules, the
following table contains the year-end, average and maximum month-end
amounts for the following respective short-term borrowing categories at the
end of each of the three prior fiscal years.