Citibank 2010 Annual Report Download - page 157
Download and view the complete annual report
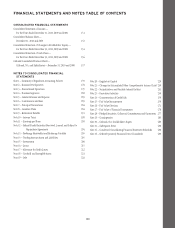
Please find page 157 of the 2010 Citibank annual report below. You can navigate through the pages in the report by either clicking on the pages listed below, or by using the keyword search tool below to find specific information within the annual report.-
 1
1 -
2
-
3
-
4
-
5
-
6
-
7
-
8
-
9
-
10
-
11
-
12
-
13
-
14
-
15
-
16
-
17
-
18
-
19
-
20
-
21
-
22
-
23
-
24
-
25
-
26
-
27
-
28
-
29
-
30
-
31
-
32
-
33
-
34
-
35
-
36
-
37
-
38
-
39
-
40
-
41
-
42
-
43
-
44
-
45
-
46
-
47
-
48
-
49
-
50
-
51
-
52
-
53
-
54
-
55
-
56
-
57
-
58
-
59
-
60
-
61
-
62
-
63
-
64
-
65
-
66
-
67
-
68
-
69
-
70
-
71
-
72
-
73
-
74
-
75
-
76
-
77
-
78
-
79
-
80
-
81
-
82
-
83
-
84
-
85
-
86
-
87
-
88
-
89
-
90
-
91
-
92
-
93
-
94
-
95
-
96
-
97
-
98
-
99
-
100
-
101
-
102
-
103
-
104
-
105
-
106
-
107
-
108
-
109
-
110
-
111
-
112
-
113
-
114
-
115
-
116
-
117
-
118
-
119
-
120
-
121
-
122
-
123
-
124
-
125
-
126
-
127
-
128
-
129
-
130
-
131
-
132
-
133
-
134
-
135
-
136
-
137
-
138
-
139
-
140
-
141
-
142
-
143
-
144
-
145
-
146
-
 147
147 -
 148
148 -
 149
149 -
 150
150 -
 151
151 -
 152
152 -
 153
153 -
 154
154 -
 155
155 -
 156
156 -
 157
157 -
 158
158 -
 159
159 -
 160
160 -
 161
161 -
 162
162 -
 163
163 -
 164
164 -
 165
165 -
 166
166 -
 167
167 -
168
-
169
-
170
-
171
-
172
-
173
-
174
-
175
-
176
-
177
-
178
-
179
-
180
-
181
-
182
-
183
-
184
-
185
-
186
-
187
-
188
-
189
-
190
-
191
-
192
-
193
-
194
-
195
-
196
-
197
-
198
-
199
-
200
-
201
-
202
-
203
-
204
-
205
-
206
-
207
-
208
-
209
-
210
-
211
-
212
-
213
-
214
-
215
-
216
-
217
-
218
-
219
-
220
-
221
-
222
-
223
-
224
-
225
-
226
-
227
-
228
-
229
-
230
-
231
-
232
-
233
-
234
-
235
-
236
-
237
-
238
-
239
-
240
-
241
-
242
-
243
-
244
-
245
-
246
-
247
-
248
-
249
-
250
-
251
-
252
-
253
-
254
-
255
-
256
-
257
-
258
-
259
-
260
-
261
-
262
-
263
-
264
-
265
-
266
-
267
-
268
-
269
-
270
-
271
-
272
-
273
-
274
-
275
-
276
-
277
-
278
-
279
-
280
-
281
-
282
-
283
-
284
-
285
-
286
-
287
-
288
-
289
-
290
-
291
-
292
-
293
-
294
-
295
-
296
-
297
-
298
-
299
-
300
-
301
-
302
-
303
-
304
-
305
-
306
-
307
-
308
-
309
-
310
-
311
-
312
 |
 |

155
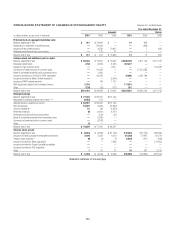
CONSOLIDATED STATEMENT OF CHANGES IN STOCKHOLDERS’ EQUITY Citigroup Inc. and Subsidiaries
(Continued)
Year ended December 31,
Amounts Shares
In millions of dollars, except shares in thousands 2010 2009 2008 2010 2009 2008
Accumulated other comprehensive income (loss)
Balance, beginning of year $ (18,937) $ (25,195) $ (4,660)
Adjustment to opening balance, net of taxes (2) —(413) —
Adjusted balance, beginning of year $ (18,937) $ (25,608) $ (4,660)
Net change in unrealized gains and losses on investment securities, net of taxes 1,952 5,713 (10,118)
Net change in cash flow hedges, net of taxes 532 2,007 (2,026)
Net change in foreign currency translation adjustment, net of taxes 820 (203) (6,972)
Pension liability adjustment, net of taxes (5) (644) (846) (1,419)
Net change in Accumulated other comprehensive income (loss) $ 2,660 $ 6,671 $ (20,535)
Balance, end of year $ (16,277) $ (18,937) $ (25,195)
Total Citigroup common stockholders’ equity and
common shares outstanding $163,156 $152,388 $ 70,966 29,058,360 28,483,267 5,450,068
Total Citigroup stockholders’ equity $163,468 $152,700 $141,630
Noncontrolling interest
Balance, beginning of year $ 2,273 $ 2,392 $ 5,308
Initial origination of a noncontrolling interest 412 285 1,409
Transactions between noncontrolling-interest
shareholders and the related consolidating subsidiary —(134) (2,348)
Transactions between Citigroup and the noncontrolling-interest shareholders (231) (354) (1,207)
Net income attributable to noncontrolling-interest shareholders 281 95 (343)
Dividends paid to noncontrolling-interest shareholders (99) (17) (168)
Accumulated other comprehensive income—net change in
unrealized gains and losses on investment securities, net of tax 15 3
Accumulated other comprehensive income—net change
in FX translation adjustment, net of tax (27) 39 (167)
All other (289) (38) (95)
Net change in noncontrolling interests $ 48 $ (119) $ (2,916)
Balance, end of year $ 2,321 $ 2,273 $ 2,392
Total equity $165,789 $154,973 $144,022
Comprehensive income (loss)
Net income (loss) before attribution of noncontrolling interests $ 10,883 $ (1,511) $ (28,027)
Net change in Accumulated other comprehensive income (loss) 2,634 6,715 (20,699)
Total comprehensive income (loss) $ 13,517 $ 5,204 $ (48,726)
Comprehensive income (loss) attributable to the
noncontrolling interests $ 255 $ 139 $ (507)
Comprehensive income (loss) attributable to Citigroup $ 13,262 $ 5,065 $ (48,219)
(1) The adjustment to the opening balance for Retained earnings in 2010 represents the cumulative effect of initially adopting ASC 810, Consolidation (formerly SFAS 167) and ASU 2010-11 (Scope Exception Related to
Embedded Credit Derivatives). See Note 1 to the Consolidated Financial Statements.
(2) The adjustment to the opening balances for Retained earnings and Accumulated other comprehensive income (loss) in 2009 represents the cumulative effect of initially adopting ASC 320-10-35-34 (FSP FAS 115-2
and FAS 124-2). See Note 1 to the Consolidated Financial Statements.
(3) Common dividends in 2010 represent a reversal of dividends accrued on forfeitures of previously issued but unvested employee stock awards related to employees who have left Citigroup. Common dividends declared
were as follows: $0.01 per share in the first quarter of 2009, $0.32 per share in the first, second and third quarters of 2008, $0.16 in the fourth quarter of 2008.
(4) All open market repurchases were transacted under an existing authorized share repurchase plan and relate to customer fails/errors.
(5) Reflects adjustments to the funded status of pension and postretirement plans, which is the difference between the fair value of the plan assets and the projected benefit obligation. See Note 9 to the Consolidated
Financial Statements.
See Notes to the Consolidated Financial Statements.