Citibank 2010 Annual Report Download - page 55
Download and view the complete annual report
Please find page 55 of the 2010 Citibank annual report below. You can navigate through the pages in the report by either clicking on the pages listed below, or by using the keyword search tool below to find specific information within the annual report.-
 1
1 -
2
-
3
-
4
-
5
-
6
-
7
-
8
-
9
-
10
-
11
-
12
-
13
-
14
-
15
-
16
-
17
-
18
-
19
-
20
-
21
-
22
-
23
-
24
-
25
-
26
-
27
-
28
-
29
-
30
-
31
-
32
-
33
-
34
-
35
-
36
-
37
-
38
-
39
-
40
-
41
-
42
-
43
-
44
-
 45
45 -
 46
46 -
 47
47 -
 48
48 -
 49
49 -
 50
50 -
 51
51 -
 52
52 -
 53
53 -
 54
54 -
 55
55 -
 56
56 -
 57
57 -
 58
58 -
 59
59 -
 60
60 -
 61
61 -
 62
62 -
 63
63 -
 64
64 -
 65
65 -
66
-
67
-
68
-
69
-
70
-
71
-
72
-
73
-
74
-
75
-
76
-
77
-
78
-
79
-
80
-
81
-
82
-
83
-
84
-
85
-
86
-
87
-
88
-
89
-
90
-
91
-
92
-
93
-
94
-
95
-
96
-
97
-
98
-
99
-
100
-
101
-
102
-
103
-
104
-
105
-
106
-
107
-
108
-
109
-
110
-
111
-
112
-
113
-
114
-
115
-
116
-
117
-
118
-
119
-
120
-
121
-
122
-
123
-
124
-
125
-
126
-
127
-
128
-
129
-
130
-
131
-
132
-
133
-
134
-
135
-
136
-
137
-
138
-
139
-
140
-
141
-
142
-
143
-
144
-
145
-
146
-
147
-
148
-
149
-
150
-
151
-
152
-
153
-
154
-
155
-
156
-
157
-
158
-
159
-
160
-
161
-
162
-
163
-
164
-
165
-
166
-
167
-
168
-
169
-
170
-
171
-
172
-
173
-
174
-
175
-
176
-
177
-
178
-
179
-
180
-
181
-
182
-
183
-
184
-
185
-
186
-
187
-
188
-
189
-
190
-
191
-
192
-
193
-
194
-
195
-
196
-
197
-
198
-
199
-
200
-
201
-
202
-
203
-
204
-
205
-
206
-
207
-
208
-
209
-
210
-
211
-
212
-
213
-
214
-
215
-
216
-
217
-
218
-
219
-
220
-
221
-
222
-
223
-
224
-
225
-
226
-
227
-
228
-
229
-
230
-
231
-
232
-
233
-
234
-
235
-
236
-
237
-
238
-
239
-
240
-
241
-
242
-
243
-
244
-
245
-
246
-
247
-
248
-
249
-
250
-
251
-
252
-
253
-
254
-
255
-
256
-
257
-
258
-
259
-
260
-
261
-
262
-
263
-
264
-
265
-
266
-
267
-
268
-
269
-
270
-
271
-
272
-
273
-
274
-
275
-
276
-
277
-
278
-
279
-
280
-
281
-
282
-
283
-
284
-
285
-
286
-
287
-
288
-
289
-
290
-
291
-
292
-
293
-
294
-
295
-
296
-
297
-
298
-
299
-
300
-
301
-
302
-
303
-
304
-
305
-
306
-
307
-
308
-
309
-
310
-
311
-
312
 |
 |

53
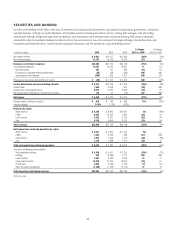
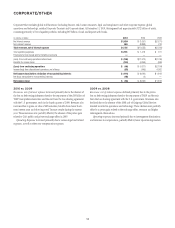
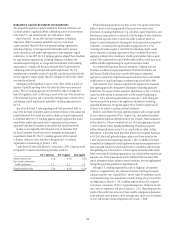
CORPORATE/OTHER
Corporate/Other includes global staff functions (including finance, risk, human resources, legal and compliance) and other corporate expense, global
operations and technology, residual Corporate Treasury and Corporate items. At December 31, 2010, this segment had approximately $272 billion of assets,
consisting primarily of Citi’s liquidity portfolio, including $87 billion of cash and deposits with banks.
In millions of dollars 2010 2009 2008
Net interest revenue $1,059 $ (1,657) $(2,671)
Non-interest revenue 695 (8,898) 413
Total revenues, net of interest expense $1,754 $(10,555) $(2,258)
Total operating expenses $1,953 $ 1,418 $ 511
Provisions for loan losses and for benefits and claims —— —
(Loss) from continuing operations before taxes $ (199) $(11,973) $(2,769)
Benefits for income taxes (153) (4,356) (585)
(Loss) from continuing operations $ (46) $ (7,617) $(2,184)
Income (loss) from discontinued operations, net of taxes (68) (445) 4,002
Net income (loss) before attribution of noncontrolling interests $ (114) $ (8,062) $ 1,818
Net (loss) attributable to noncontrolling interests (48) (2) —
Net income (loss) $ (66) $ (8,060) $ 1,818
2010 vs. 2009
Revenues, net of interest expense increased primarily due to the absence of
the loss on debt extinguishment related to the repayment of the $20 billion of
TARP trust preferred securities and the exit from the loss-sharing agreement
with the U.S. government, each in the fourth quarter of 2009. Revenues also
increased due to gains on sales of AFS securities, benefits from lower short-
term interest rates and other improved Treasury results during the current
year. These increases were partially offset by the absence of the pretax gain
related to Citi’s public and private exchange offers in 2009.
Operating Expenses increased primarily due to various legal and related
expenses, as well as other non-compensation expenses.
2009 vs. 2008
Revenues, net of interest expense declined primarily due to the pretax
loss on debt extinguishment related to the repayment of TARP and the exit
from the loss-sharing agreement with the U.S. government. Revenues also
declined due to the absence of the 2008 sale of Citigroup Global Services
Limited recorded in operations and technology. These declines were partially
offset by a pretax gain related to the exchange offers, revenues and higher
intersegment eliminations.
Operating expenses increased primarily due to intersegment eliminations
and increases in compensation, partially offset by lower repositioning reserves.