Citibank 2010 Annual Report Download - page 8
Download and view the complete annual report
Please find page 8 of the 2010 Citibank annual report below. You can navigate through the pages in the report by either clicking on the pages listed below, or by using the keyword search tool below to find specific information within the annual report.-
 1
1 -
 2
2 -
 3
3 -
 4
4 -
 5
5 -
 6
6 -
 7
7 -
 8
8 -
 9
9 -
 10
10 -
 11
11 -
 12
12 -
 13
13 -
 14
14 -
 15
15 -
 16
16 -
 17
17 -
 18
18 -
 19
19 -
20
-
21
-
22
-
23
-
24
-
25
-
26
-
27
-
28
-
29
-
30
-
31
-
32
-
33
-
34
-
35
-
36
-
37
-
38
-
39
-
40
-
41
-
42
-
43
-
44
-
45
-
46
-
47
-
48
-
49
-
50
-
51
-
52
-
53
-
54
-
55
-
56
-
57
-
58
-
59
-
60
-
61
-
62
-
63
-
64
-
65
-
66
-
67
-
68
-
69
-
70
-
71
-
72
-
73
-
74
-
75
-
76
-
77
-
78
-
79
-
80
-
81
-
82
-
83
-
84
-
85
-
86
-
87
-
88
-
89
-
90
-
91
-
92
-
93
-
94
-
95
-
96
-
97
-
98
-
99
-
100
-
101
-
102
-
103
-
104
-
105
-
106
-
107
-
108
-
109
-
110
-
111
-
112
-
113
-
114
-
115
-
116
-
117
-
118
-
119
-
120
-
121
-
122
-
123
-
124
-
125
-
126
-
127
-
128
-
129
-
130
-
131
-
132
-
133
-
134
-
135
-
136
-
137
-
138
-
139
-
140
-
141
-
142
-
143
-
144
-
145
-
146
-
147
-
148
-
149
-
150
-
151
-
152
-
153
-
154
-
155
-
156
-
157
-
158
-
159
-
160
-
161
-
162
-
163
-
164
-
165
-
166
-
167
-
168
-
169
-
170
-
171
-
172
-
173
-
174
-
175
-
176
-
177
-
178
-
179
-
180
-
181
-
182
-
183
-
184
-
185
-
186
-
187
-
188
-
189
-
190
-
191
-
192
-
193
-
194
-
195
-
196
-
197
-
198
-
199
-
200
-
201
-
202
-
203
-
204
-
205
-
206
-
207
-
208
-
209
-
210
-
211
-
212
-
213
-
214
-
215
-
216
-
217
-
218
-
219
-
220
-
221
-
222
-
223
-
224
-
225
-
226
-
227
-
228
-
229
-
230
-
231
-
232
-
233
-
234
-
235
-
236
-
237
-
238
-
239
-
240
-
241
-
242
-
243
-
244
-
245
-
246
-
247
-
248
-
249
-
250
-
251
-
252
-
253
-
254
-
255
-
256
-
257
-
258
-
259
-
260
-
261
-
262
-
263
-
264
-
265
-
266
-
267
-
268
-
269
-
270
-
271
-
272
-
273
-
274
-
275
-
276
-
277
-
278
-
279
-
280
-
281
-
282
-
283
-
284
-
285
-
286
-
287
-
288
-
289
-
290
-
291
-
292
-
293
-
294
-
295
-
296
-
297
-
298
-
299
-
300
-
301
-
302
-
303
-
304
-
305
-
306
-
307
-
308
-
309
-
310
-
311
-
312
 |
 |

6
deepen relationships with priority clients through our two
major businesses, Treasury and Trade Solutions and Securities
and Fund Services. Citi’s GTS franchise brings in highly stable
revenues with relatively low capital usage, making it one of the
most attractive businesses in our industry.
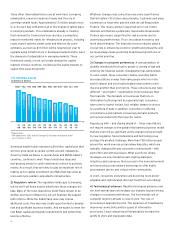
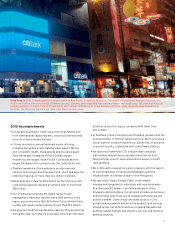
In Regional Consumer Banking, we are pursuing a strategy of
appealing to affluent consumers in the top 150 international
cities. Nearly half of our 2010 consumer banking revenues were
generated in emerging markets, where margins are higher and
growth prospects brighter. We will continue to invest in more
and better branches in our priority urban markets, even as we
create “perceptual scale” through innovative distribution
channels and products and digital banking platforms that make
our service both more effective and more ubiquitous. We are
the bank of choice for globally minded consumers and are
working to become the same for trade-oriented small and
mid-size companies looking to fulfill their international needs.
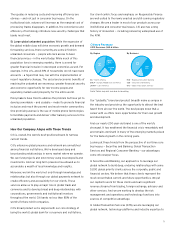
These three business segments overlap in a variety of ways
to create synergies that significantly improve client service
and our results. Our goal — and expectation — is to derive
half of our revenues from emerging markets and half from
developed economies, with a balanced mix across these three
key businesses.
Key Execution Priorities
We have identified eight key execution priorities for 2011
and beyond:
1) Increase our share of emerging-market flows, including
capital trade and flows. In 2010, we sharpened our focus on
capturing a larger share of capital trade and flows from, into
and especially within emerging markets. Plans for the future
include improving client coverage models, adding and moving
key talent to and within key markets, investing in infrastructure,
creating content that provides unique insights into emerging
markets and making more capital available to clients in
priority markets.
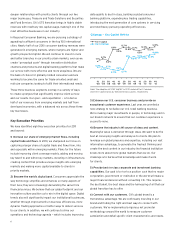
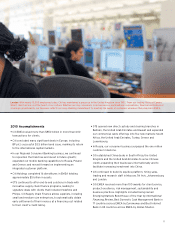
2) Become the world’s digital bank. Consumers appreciate the
way technology simplifies and enhances so many aspects of
their lives; they are increasingly demanding the same from
financial services. We believe that our global footprint and our
innovative culture position us to win in the digital space. Digital
trends also will significantly impact our institutional businesses,
whether through improvements in business efficiencies, more
dynamic trading approaches or better ways to deliver services
to our clients. In addition, we will continue to drive our
operations and technology agenda — which includes improving
data quality to best in class, building a global consumer
banking platform, expanding key trading capabilities,
introducing the next generation of core systems in servicing
and relentlessly pursuing operating efficiencies.
3) Enhance our U.S. consumer business and provide an
exceptional customer experience. Last year, we unveiled a
new strategy to revitalize our U.S. retail banking business.
We’re making major investments in people, in technology and in
our branch network to ensure that our customer experience is
second to none.
4) Become the industry’s #1 source of ideas and content.
Meaningful value is delivered through ideas. We want to be the
best at conveying insights and analysis to clients. We plan to
leverage our global presence and expertise, including our vast
information advantage, to generate the freshest thinking and
create the best content in our industry. No financial institution
knows more about more global markets than we do. Our
challenge is to harness that knowledge and make it work
for clients.
5) Provide best-in-class corporate and investment banking
capabilities. Our goal is to rise to a position such that no major
corporation, government or institution in the world will make a
major financial decision without consulting Citi. This requires
the best talent, the best ideas and the harnessing of all that our
global franchise has to offer.
6) Connect with our customers. Citi’s global brand is a
tremendous advantage. We are continually investing in our
brand and finding the right and best ways to connect with
customers. We’ve implemented a rigorous net promoter
methodology around the world to measure customer
satisfaction and detail specific client characteristics and needs.
1Q
’08
3Q
’08
1Q
’09
3Q
’09
1Q
’10
3Q
’10
2Q
’08
4Q
’08
2Q
’09
4Q
’09
2Q
’10
4Q
’10
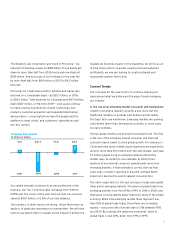
7.7%
8.2%
11.9% 12.8%
11.3%
12.5%
8.7%
Tier 1 Capital
Tier 1 Common
11.9% 12.7%
11.7% 12.0%
12.9%
4.2% 3.7% 2.2%
9.1% 9.1% 10.3%
4.4%
2.3% 2.7%
9.6% 9.7%
10.8%
Citigroup — Key Capital Metrics
Note: The adoption of SFAS 166/167 in 1Q’10 reduced Tier 1 Common
and Tier 1 Capital ratios by 138 and 141 basis points, respectively.