Citibank 2010 Annual Report Download - page 224
Download and view the complete annual report
Please find page 224 of the 2010 Citibank annual report below. You can navigate through the pages in the report by either clicking on the pages listed below, or by using the keyword search tool below to find specific information within the annual report.-
 1
1 -
2
-
3
-
4
-
5
-
6
-
7
-
8
-
9
-
10
-
11
-
12
-
13
-
14
-
15
-
16
-
17
-
18
-
19
-
20
-
21
-
22
-
23
-
24
-
25
-
26
-
27
-
28
-
29
-
30
-
31
-
32
-
33
-
34
-
35
-
36
-
37
-
38
-
39
-
40
-
41
-
42
-
43
-
44
-
45
-
46
-
47
-
48
-
49
-
50
-
51
-
52
-
53
-
54
-
55
-
56
-
57
-
58
-
59
-
60
-
61
-
62
-
63
-
64
-
65
-
66
-
67
-
68
-
69
-
70
-
71
-
72
-
73
-
74
-
75
-
76
-
77
-
78
-
79
-
80
-
81
-
82
-
83
-
84
-
85
-
86
-
87
-
88
-
89
-
90
-
91
-
92
-
93
-
94
-
95
-
96
-
97
-
98
-
99
-
100
-
101
-
102
-
103
-
104
-
105
-
106
-
107
-
108
-
109
-
110
-
111
-
112
-
113
-
114
-
115
-
116
-
117
-
118
-
119
-
120
-
121
-
122
-
123
-
124
-
125
-
126
-
127
-
128
-
129
-
130
-
131
-
132
-
133
-
134
-
135
-
136
-
137
-
138
-
139
-
140
-
141
-
142
-
143
-
144
-
145
-
146
-
147
-
148
-
149
-
150
-
151
-
152
-
153
-
154
-
155
-
156
-
157
-
158
-
159
-
160
-
161
-
162
-
163
-
164
-
165
-
166
-
167
-
168
-
169
-
170
-
171
-
172
-
173
-
174
-
175
-
176
-
177
-
178
-
179
-
180
-
181
-
182
-
183
-
184
-
185
-
186
-
187
-
188
-
189
-
190
-
191
-
192
-
193
-
194
-
195
-
196
-
197
-
198
-
199
-
200
-
201
-
202
-
203
-
204
-
205
-
206
-
207
-
208
-
209
-
210
-
211
-
212
-
213
-
 214
214 -
 215
215 -
 216
216 -
 217
217 -
 218
218 -
 219
219 -
 220
220 -
 221
221 -
 222
222 -
 223
223 -
 224
224 -
 225
225 -
 226
226 -
 227
227 -
 228
228 -
 229
229 -
 230
230 -
 231
231 -
 232
232 -
 233
233 -
 234
234 -
235
-
236
-
237
-
238
-
239
-
240
-
241
-
242
-
243
-
244
-
245
-
246
-
247
-
248
-
249
-
250
-
251
-
252
-
253
-
254
-
255
-
256
-
257
-
258
-
259
-
260
-
261
-
262
-
263
-
264
-
265
-
266
-
267
-
268
-
269
-
270
-
271
-
272
-
273
-
274
-
275
-
276
-
277
-
278
-
279
-
280
-
281
-
282
-
283
-
284
-
285
-
286
-
287
-
288
-
289
-
290
-
291
-
292
-
293
-
294
-
295
-
296
-
297
-
298
-
299
-
300
-
301
-
302
-
303
-
304
-
305
-
306
-
307
-
308
-
309
-
310
-
311
-
312
 |
 |

222
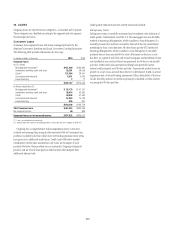
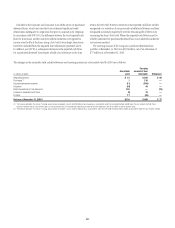
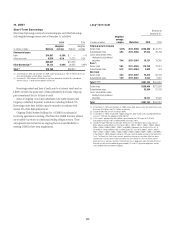
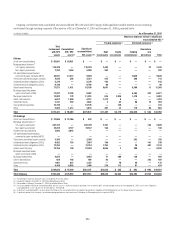
17. ALLOWANCE FOR CREDIT LOSSES
In millions of dollars 2010 2009 2008
Allowance for loan losses at beginning of year $ 36,033 $ 29,616 $ 16,117
Gross credit losses (34,491) (32,784) (20,760)
Gross recoveries 3,632 2,043 1,749
Net credit (losses) recoveries (NCLs) $(30,859) $(30,741) $(19,011)
NCLs $ 30,859 $ 30,741 $ 19,011
Net reserve builds (releases) (6,523) 5,741 11,297
Net specific reserve builds (releases) 858 2,278 3,366
Total provision for credit losses $ 25,194 $ 38,760 $ 33,674
Other, net (1) 10,287 (1,602) (1,164)
Allowance for loan losses at end of year $ 40,655 $ 36,033 $ 29,616
Allowance for credit losses on unfunded lending commitments at beginning of year (2) $ 1,157 $ 887 $ 1,250
Provision for unfunded lending commitments (117) 244 (363)
Allowance for credit losses on unfunded lending commitments at end of year (2) $ 1,066 $ 1,157 $ 887
Total allowance for loans, leases, and unfunded lending commitments $ 41,721 $ 37,190 $ 30,503
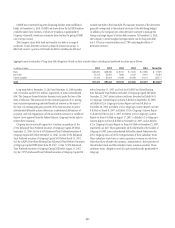
(1) 2010 primarily includes an addition of $13.4 billion related to the impact of consolidating entities in connection with Citi’s adoption of SFAS 166/167 (see Note 1 to the Consolidated Financial Statements) and
reductions of approximately $2.7 billion related to the sale or transfer to held-for-sale of various U.S. loan portfolios and approximately $290 million related to the transfer of a U.K. first mortgage portfolio to held-for-
sale. 2009 primarily includes reductions to the loan loss reserve of approximately $543 million related to securitizations, approximately $402 million related to the sale or transfers to held-for-sale of U.S. real estate
lending loans, and $562 million related to the transfer of the U.K. cards portfolio to held-for-sale. 2008 primarily includes reductions to the loan loss reserve of approximately $800 million related to FX translation,
$102 million related to securitizations, $244 million for the sale of the German retail banking operation, and $156 million for the sale of CitiCapital, partially offset by additions of $106 million related to the Cuscatlán
and Bank of Overseas Chinese acquisitions.
(2) Represents additional credit loss reserves for unfunded lending commitments and letters of credit recorded in Other Liabilities on the Consolidated Balance Sheet.
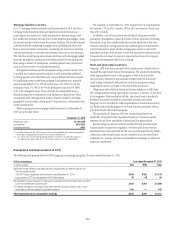
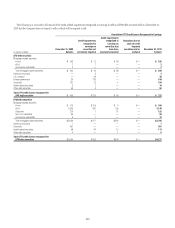
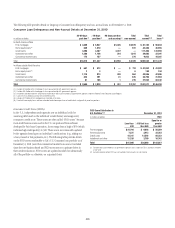
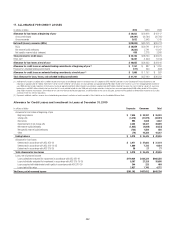
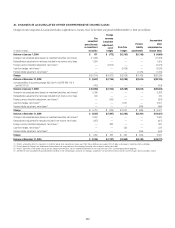
Allowance for Credit Losses and Investment in Loans at December 31, 2010
In millions of dollars Corporate Consumer Total
Allowance for loan losses at beginning of year
Beginning balance $ 7,636 $ 28,397 $ 36,033
Charge-offs (3,416) (31,075) (34,491)
Recoveries 994 2,638 3,632
Replenishment of net charge-offs 2,422 28,437 30,859
Net reserve builds/(releases) (1,625) (4,898) (6,523)
Net specific reserve builds/(releases) (722) 1,580 858
Other (79) 10,366 10,287
Ending balance $ 5,210 $ 35,445 $ 40,655
Allowance for loan losses
Determined in accordance with ASC 450-20 $ 3,471 $ 27,683 $ 31,154
Determined in accordance with ASC 310-10-35 1,689 7,735 9,424
Determined in accordance with ASC 310-30 50 27 77
Total allowance for loan losses $ 5,210 $ 35,445 $ 40,655
Loans, net of unearned income
Loans collectively evaluated for impairment in accordance with ASC 450-20 $179,924 $428,334 $608,258
Loans individually evaluated for impairment in accordance with ASC 310-10-35 8,367 27,328 35,695
Loans acquired with deteriorated credit quality in accordance with ASC 310-30 244 225 469
Loans held at fair value 2,627 1,745 4,372
Total loans, net of unearned income $191,162 $457,632 $648,794