Citibank 2010 Annual Report Download - page 120
Download and view the complete annual report
Please find page 120 of the 2010 Citibank annual report below. You can navigate through the pages in the report by either clicking on the pages listed below, or by using the keyword search tool below to find specific information within the annual report.-
 1
1 -
2
-
3
-
4
-
5
-
6
-
7
-
8
-
9
-
10
-
11
-
12
-
13
-
14
-
15
-
16
-
17
-
18
-
19
-
20
-
21
-
22
-
23
-
24
-
25
-
26
-
27
-
28
-
29
-
30
-
31
-
32
-
33
-
34
-
35
-
36
-
37
-
38
-
39
-
40
-
41
-
42
-
43
-
44
-
45
-
46
-
47
-
48
-
49
-
50
-
51
-
52
-
53
-
54
-
55
-
56
-
57
-
58
-
59
-
60
-
61
-
62
-
63
-
64
-
65
-
66
-
67
-
68
-
69
-
70
-
71
-
72
-
73
-
74
-
75
-
76
-
77
-
78
-
79
-
80
-
81
-
82
-
83
-
84
-
85
-
86
-
87
-
88
-
89
-
90
-
91
-
92
-
93
-
94
-
95
-
96
-
97
-
98
-
99
-
100
-
101
-
102
-
103
-
104
-
105
-
106
-
107
-
108
-
109
-
 110
110 -
 111
111 -
 112
112 -
 113
113 -
 114
114 -
 115
115 -
 116
116 -
 117
117 -
 118
118 -
 119
119 -
 120
120 -
 121
121 -
 122
122 -
 123
123 -
 124
124 -
 125
125 -
 126
126 -
 127
127 -
 128
128 -
 129
129 -
 130
130 -
131
-
132
-
133
-
134
-
135
-
136
-
137
-
138
-
139
-
140
-
141
-
142
-
143
-
144
-
145
-
146
-
147
-
148
-
149
-
150
-
151
-
152
-
153
-
154
-
155
-
156
-
157
-
158
-
159
-
160
-
161
-
162
-
163
-
164
-
165
-
166
-
167
-
168
-
169
-
170
-
171
-
172
-
173
-
174
-
175
-
176
-
177
-
178
-
179
-
180
-
181
-
182
-
183
-
184
-
185
-
186
-
187
-
188
-
189
-
190
-
191
-
192
-
193
-
194
-
195
-
196
-
197
-
198
-
199
-
200
-
201
-
202
-
203
-
204
-
205
-
206
-
207
-
208
-
209
-
210
-
211
-
212
-
213
-
214
-
215
-
216
-
217
-
218
-
219
-
220
-
221
-
222
-
223
-
224
-
225
-
226
-
227
-
228
-
229
-
230
-
231
-
232
-
233
-
234
-
235
-
236
-
237
-
238
-
239
-
240
-
241
-
242
-
243
-
244
-
245
-
246
-
247
-
248
-
249
-
250
-
251
-
252
-
253
-
254
-
255
-
256
-
257
-
258
-
259
-
260
-
261
-
262
-
263
-
264
-
265
-
266
-
267
-
268
-
269
-
270
-
271
-
272
-
273
-
274
-
275
-
276
-
277
-
278
-
279
-
280
-
281
-
282
-
283
-
284
-
285
-
286
-
287
-
288
-
289
-
290
-
291
-
292
-
293
-
294
-
295
-
296
-
297
-
298
-
299
-
300
-
301
-
302
-
303
-
304
-
305
-
306
-
307
-
308
-
309
-
310
-
311
-
312
 |
 |

118
Mitigation and Hedging of Risk
Financial institutions’ financial performance is subject to some degree of risk due
to changes in interest rates. In order to manage these risks effectively, Citigroup
may modify pricing on new customer loans and deposits, enter into transactions
with other institutions or enter into off-balance-sheet derivative transactions that
have the opposite risk exposures. Thus, Citigroup regularly assesses the viability of
strategies to reduce unacceptable risks to earnings and implements such strategies
when it believes those actions are prudent. As information becomes available,
Citigroup formulates strategies aimed at protecting earnings from the potential
negative effects of changes in interest rates.
Citigroup employs additional measurements, including stress testing the
impact of non-linear interest rate movements on the value of the balance
sheet; the analysis of portfolio duration and volatility, particularly as they
relate to mortgage loans and mortgage-backed securities; and the potential
impact of the change in the spread between different market indices.
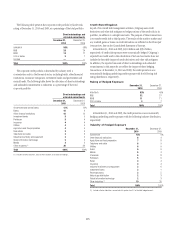
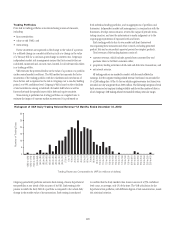
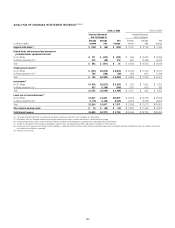
Non-Trading Portfolios
The exposures in the following table represent the approximate annualized
risk to NIR assuming an unanticipated parallel instantaneous 100 bps
change, as well as a more gradual 100 bps (25 bps per quarter) parallel
change in rates compared with the market forward interest rates in selected
currencies.
December 31, 2010 December 31, 2009
In millions of dollars Increase Decrease Increase Decrease
U.S. dollar
Instantaneous change $(105) NM $ (859) NM
Gradual change 25 NM (460) NM
Mexican peso
Instantaneous change $ 181 $(181) $ 50 $ (50)
Gradual change 107 (107) 26 (26)
Euro
Instantaneous change $ (10) $ (38) $ 85 NM
Gradual change (8) 8 47 NM
Japanese yen
Instantaneous change $ 93 NM $ 200 NM
Gradual change 52 NM 116 NM
Pound sterling
Instantaneous change $ 33 $ (20) $ (11) NM
Gradual change 21 (21) (6) NM
NM Not meaningful
A 100 bps decrease in interest rates would imply negative rates for the yield curve.
The changes in the U.S. dollar IRE from the prior year reflect revised
modeling of mortgages and deposits based on lower rates, pricing changes
due to the CARD Act, asset sales, debt issuance and swapping activities, as well
as repositioning of the liquidity portfolio.
Certain trading-oriented businesses within Citi have accrual-accounted
positions that are excluded from the table above. The U.S. dollar IRE
associated with these businesses is $(79) million for a 100 basis point
instantaneous increase in interest rates.
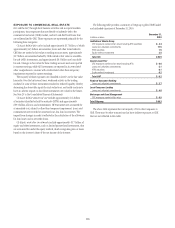
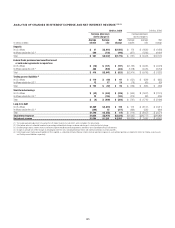
The following table shows the risk to NIR from six different changes in the implied-forward rates. Each scenario assumes that the rate change will occur on a
gradual basis every three months over the course of one year.
Scenario 1 Scenario 2 Scenario 3 Scenario 4 Scenario 5 Scenario 6
Overnight rate change (bps) — 100 200 (200) (100) —
10-year rate change (bps) (100) — 100 (100) — 100
Impact to net interest revenue (in millions of dollars) $(135) $ 61 $ (39) NM NM $ (21)