Citibank 2010 Annual Report Download - page 160
Download and view the complete annual report
Please find page 160 of the 2010 Citibank annual report below. You can navigate through the pages in the report by either clicking on the pages listed below, or by using the keyword search tool below to find specific information within the annual report.-
 1
1 -
2
-
3
-
4
-
5
-
6
-
7
-
8
-
9
-
10
-
11
-
12
-
13
-
14
-
15
-
16
-
17
-
18
-
19
-
20
-
21
-
22
-
23
-
24
-
25
-
26
-
27
-
28
-
29
-
30
-
31
-
32
-
33
-
34
-
35
-
36
-
37
-
38
-
39
-
40
-
41
-
42
-
43
-
44
-
45
-
46
-
47
-
48
-
49
-
50
-
51
-
52
-
53
-
54
-
55
-
56
-
57
-
58
-
59
-
60
-
61
-
62
-
63
-
64
-
65
-
66
-
67
-
68
-
69
-
70
-
71
-
72
-
73
-
74
-
75
-
76
-
77
-
78
-
79
-
80
-
81
-
82
-
83
-
84
-
85
-
86
-
87
-
88
-
89
-
90
-
91
-
92
-
93
-
94
-
95
-
96
-
97
-
98
-
99
-
100
-
101
-
102
-
103
-
104
-
105
-
106
-
107
-
108
-
109
-
110
-
111
-
112
-
113
-
114
-
115
-
116
-
117
-
118
-
119
-
120
-
121
-
122
-
123
-
124
-
125
-
126
-
127
-
128
-
129
-
130
-
131
-
132
-
133
-
134
-
135
-
136
-
137
-
138
-
139
-
140
-
141
-
142
-
143
-
144
-
145
-
146
-
147
-
148
-
149
-
 150
150 -
 151
151 -
 152
152 -
 153
153 -
 154
154 -
 155
155 -
 156
156 -
 157
157 -
 158
158 -
 159
159 -
 160
160 -
 161
161 -
 162
162 -
 163
163 -
 164
164 -
 165
165 -
 166
166 -
 167
167 -
 168
168 -
 169
169 -
 170
170 -
171
-
172
-
173
-
174
-
175
-
176
-
177
-
178
-
179
-
180
-
181
-
182
-
183
-
184
-
185
-
186
-
187
-
188
-
189
-
190
-
191
-
192
-
193
-
194
-
195
-
196
-
197
-
198
-
199
-
200
-
201
-
202
-
203
-
204
-
205
-
206
-
207
-
208
-
209
-
210
-
211
-
212
-
213
-
214
-
215
-
216
-
217
-
218
-
219
-
220
-
221
-
222
-
223
-
224
-
225
-
226
-
227
-
228
-
229
-
230
-
231
-
232
-
233
-
234
-
235
-
236
-
237
-
238
-
239
-
240
-
241
-
242
-
243
-
244
-
245
-
246
-
247
-
248
-
249
-
250
-
251
-
252
-
253
-
254
-
255
-
256
-
257
-
258
-
259
-
260
-
261
-
262
-
263
-
264
-
265
-
266
-
267
-
268
-
269
-
270
-
271
-
272
-
273
-
274
-
275
-
276
-
277
-
278
-
279
-
280
-
281
-
282
-
283
-
284
-
285
-
286
-
287
-
288
-
289
-
290
-
291
-
292
-
293
-
294
-
295
-
296
-
297
-
298
-
299
-
300
-
301
-
302
-
303
-
304
-
305
-
306
-
307
-
308
-
309
-
310
-
311
-
312
 |
 |

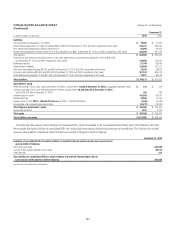
158
CITIBANK CONSOLIDATED BALANCE SHEET Citibank, N.A. and Subsidiaries
(Continued)
December 31,
In millions of dollars, except shares 2010 2009
Liabilities
Non-interest-bearing deposits in U.S. offices $ 86,322 $ 76,729
Interest-bearing deposits in U.S. offices 170,128 176,149
Non-interest-bearing deposits in offices outside the U.S. 48,873 39,414
Interest-bearing deposits in offices outside the U.S. 488,514 479,350
Total deposits $ 793,837 $ 771,642
Trading account liabilities 57,222 52,010
Purchased funds and other borrowings 66,581 89,503
Accrued taxes and other expenses 8,758 9,046
Long-term debt and subordinated notes 59,151 82,086
Other liabilities 40,784 39,181
Total liabilities $1,026,333 $1,043,468
Citibank stockholder’s equity
Capital stock ($20 par value) outstanding shares: 37,534,553 in each period $ 751 $ 751
Surplus 109,419 107,923
Retained earnings 27,082 19,457
Accumulated other comprehensive income (loss) (1) (10,162) (11,532)
Total Citibank stockholder’s equity $ 127,090 $ 116,599
Noncontrolling interest 870 1,294
Total equity $ 127,960 $ 117,893
Total liabilities and equity $1,154,293 $1,161,361
(1) Amounts at December 31, 2010 and 2009 include the after-tax amounts for net unrealized gains (losses) on investment securities of $(3.573) billion and $(4.735) billion, respectively, for foreign currency translation of
$(3.226) billion and $(3.255) billion, respectively, for cash flow hedges of $(1.894) billion and $(2.367) billion, respectively, and for pension liability adjustments of $(1.469) billion and $(1.175) billion, respectively.
The following table presents certain liabilities of consolidated VIEs, which are included in the Consolidated Balance Sheet above. The liabilities in the table
below include third-party liabilities of consolidated VIEs only, and exclude intercompany balances that eliminate in consolidation.
In millions of dollars December 31, 2010
Liabilities of consolidated VIEs for which creditors or beneficial interest holders do not have recourse to the general credit of Citibank
Short-term borrowings $22,753
Long-term debt (including $1,870 at fair value) 4,822
Other liabilities 146
Total liabilities of consolidated VIEs for which creditors or beneficial interest holders do not have recourse to the general credit of Citibank $27,721
See Notes to the Consolidated Financial Statements.