Citibank 2010 Annual Report Download - page 212
Download and view the complete annual report
Please find page 212 of the 2010 Citibank annual report below. You can navigate through the pages in the report by either clicking on the pages listed below, or by using the keyword search tool below to find specific information within the annual report.-
 1
1 -
2
-
3
-
4
-
5
-
6
-
7
-
8
-
9
-
10
-
11
-
12
-
13
-
14
-
15
-
16
-
17
-
18
-
19
-
20
-
21
-
22
-
23
-
24
-
25
-
26
-
27
-
28
-
29
-
30
-
31
-
32
-
33
-
34
-
35
-
36
-
37
-
38
-
39
-
40
-
41
-
42
-
43
-
44
-
45
-
46
-
47
-
48
-
49
-
50
-
51
-
52
-
53
-
54
-
55
-
56
-
57
-
58
-
59
-
60
-
61
-
62
-
63
-
64
-
65
-
66
-
67
-
68
-
69
-
70
-
71
-
72
-
73
-
74
-
75
-
76
-
77
-
78
-
79
-
80
-
81
-
82
-
83
-
84
-
85
-
86
-
87
-
88
-
89
-
90
-
91
-
92
-
93
-
94
-
95
-
96
-
97
-
98
-
99
-
100
-
101
-
102
-
103
-
104
-
105
-
106
-
107
-
108
-
109
-
110
-
111
-
112
-
113
-
114
-
115
-
116
-
117
-
118
-
119
-
120
-
121
-
122
-
123
-
124
-
125
-
126
-
127
-
128
-
129
-
130
-
131
-
132
-
133
-
134
-
135
-
136
-
137
-
138
-
139
-
140
-
141
-
142
-
143
-
144
-
145
-
146
-
147
-
148
-
149
-
150
-
151
-
152
-
153
-
154
-
155
-
156
-
157
-
158
-
159
-
160
-
161
-
162
-
163
-
164
-
165
-
166
-
167
-
168
-
169
-
170
-
171
-
172
-
173
-
174
-
175
-
176
-
177
-
178
-
179
-
180
-
181
-
182
-
183
-
184
-
185
-
186
-
187
-
188
-
189
-
190
-
191
-
192
-
193
-
194
-
195
-
196
-
197
-
198
-
199
-
200
-
201
-
 202
202 -
 203
203 -
 204
204 -
 205
205 -
 206
206 -
 207
207 -
 208
208 -
 209
209 -
 210
210 -
 211
211 -
 212
212 -
 213
213 -
 214
214 -
 215
215 -
 216
216 -
 217
217 -
 218
218 -
 219
219 -
 220
220 -
 221
221 -
 222
222 -
223
-
224
-
225
-
226
-
227
-
228
-
229
-
230
-
231
-
232
-
233
-
234
-
235
-
236
-
237
-
238
-
239
-
240
-
241
-
242
-
243
-
244
-
245
-
246
-
247
-
248
-
249
-
250
-
251
-
252
-
253
-
254
-
255
-
256
-
257
-
258
-
259
-
260
-
261
-
262
-
263
-
264
-
265
-
266
-
267
-
268
-
269
-
270
-
271
-
272
-
273
-
274
-
275
-
276
-
277
-
278
-
279
-
280
-
281
-
282
-
283
-
284
-
285
-
286
-
287
-
288
-
289
-
290
-
291
-
292
-
293
-
294
-
295
-
296
-
297
-
298
-
299
-
300
-
301
-
302
-
303
-
304
-
305
-
306
-
307
-
308
-
309
-
310
-
311
-
312
 |
 |

210
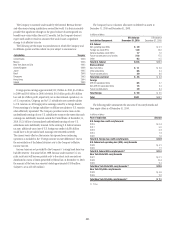
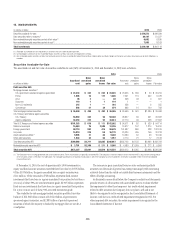
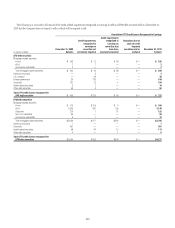
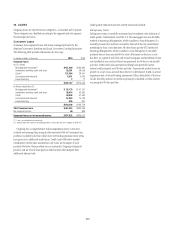
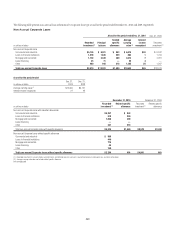
The table below shows the fair value of investments in HTM that have been in an unrecognized loss position for less than 12 months or for 12 months or longer
as of December 31, 2010 and December 31, 2009:
Less than 12 months 12 months or longer Total
In millions of dollars
Fair
value
Gross
unrecognized
losses
Fair
value
Gross
unrecognized
losses
Fair
value
Gross
unrecognized
losses
December 31, 2010
Debt securities held-to-maturity
Mortgage-backed securities $ 339 $ 30 $14,410 $ 387 $14,749 $ 417
State and municipal 24 — 1,273 104 1,297 104
Corporate 1,584 143 1,579 124 3,163 267
Asset-backed securities 159 11 494 43 653 54
Total debt securities held-to-maturity $ 2,106 $ 184 $17,756 $ 658 $19,862 $ 842
December 31, 2009
Debt securities held-to-maturity
Mortgage-backed securities $ — $ — $16,923 $ 690 $16,923 $ 690
State and municipal 755 79 713 34 1,468 113
Corporate — — 1,519 182 1,519 182
Asset-backed securities 348 18 5,460 478 5,808 496
Total debt securities held-to-maturity $ 1,103 $ 97 $24,615 $ 1,384 $25,718 $1,481
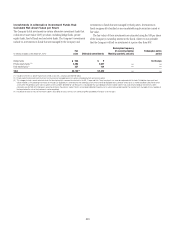
Excluded from the gross unrecognized losses presented in the above table
are the $5.0 billion and $7.6 billion of gross unrealized losses recorded in
AOCI mainly related to the HTM securities that were reclassified from AFS
investments as of December 31, 2010 and December 31, 2009, respectively.
Virtually all of these unrealized losses relate to securities that have been
in a loss position for 12 months or longer at both December 31, 2010 and
December 31, 2009.
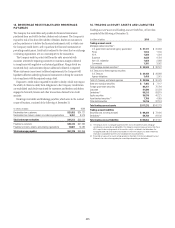
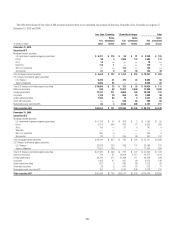
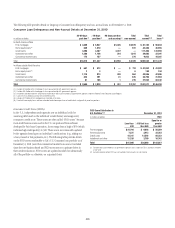
The following table presents the carrying value and fair value of HTM debt securities by contractual maturity dates as of December 31, 2010 and
December 31, 2009:
December 31, 2010 December 31, 2009
In millions of dollars Carrying value Fair value Carrying value Fair value
Mortgage-backed securities
Due within 1 year $ 21 $ 23 $ 1 $ 1
After 1 but within 5 years 321 309 466 385
After 5 but within 10 years 493 434 697 605
After 10 years (1) 17,664 18,517 24,337 25,589
Total $18,499 $19,283 $25,501 $26,580
State and municipal
Due within 1 year $ 12 $ 12 $ 6 $ 6
After 1 but within 5 years 55 55 53 79
After 5 but within 10 years 86 85 99 99
After 10 years (1) 2,243 2,151 2,762 2,715
Total $ 2,396 $ 2,303 $ 2,920 $ 2,899
All other (2)
Due within 1 year $ 351 $ 357 $ 4,652 $ 4,875
After 1 but within 5 years 1,344 1,621 3,795 3,858
After 5 but within 10 years 4,885 4,765 6,240 6,526
After 10 years (1) 1,632 1,652 8,419 8,260
Total $ 8,212 $ 8,395 $23,106 $23,519
Total debt securities held-to-maturity $29,107 $29,981 $51,527 $52,998
(1) Investments with no stated maturities are included as contractual maturities of greater than 10 years. Actual maturities may differ due to call or prepayment rights.
(2) Includes corporate and asset-backed securities.