Citibank 2010 Annual Report Download - page 269
Download and view the complete annual report
Please find page 269 of the 2010 Citibank annual report below. You can navigate through the pages in the report by either clicking on the pages listed below, or by using the keyword search tool below to find specific information within the annual report.-
 1
1 -
2
-
3
-
4
-
5
-
6
-
7
-
8
-
9
-
10
-
11
-
12
-
13
-
14
-
15
-
16
-
17
-
18
-
19
-
20
-
21
-
22
-
23
-
24
-
25
-
26
-
27
-
28
-
29
-
30
-
31
-
32
-
33
-
34
-
35
-
36
-
37
-
38
-
39
-
40
-
41
-
42
-
43
-
44
-
45
-
46
-
47
-
48
-
49
-
50
-
51
-
52
-
53
-
54
-
55
-
56
-
57
-
58
-
59
-
60
-
61
-
62
-
63
-
64
-
65
-
66
-
67
-
68
-
69
-
70
-
71
-
72
-
73
-
74
-
75
-
76
-
77
-
78
-
79
-
80
-
81
-
82
-
83
-
84
-
85
-
86
-
87
-
88
-
89
-
90
-
91
-
92
-
93
-
94
-
95
-
96
-
97
-
98
-
99
-
100
-
101
-
102
-
103
-
104
-
105
-
106
-
107
-
108
-
109
-
110
-
111
-
112
-
113
-
114
-
115
-
116
-
117
-
118
-
119
-
120
-
121
-
122
-
123
-
124
-
125
-
126
-
127
-
128
-
129
-
130
-
131
-
132
-
133
-
134
-
135
-
136
-
137
-
138
-
139
-
140
-
141
-
142
-
143
-
144
-
145
-
146
-
147
-
148
-
149
-
150
-
151
-
152
-
153
-
154
-
155
-
156
-
157
-
158
-
159
-
160
-
161
-
162
-
163
-
164
-
165
-
166
-
167
-
168
-
169
-
170
-
171
-
172
-
173
-
174
-
175
-
176
-
177
-
178
-
179
-
180
-
181
-
182
-
183
-
184
-
185
-
186
-
187
-
188
-
189
-
190
-
191
-
192
-
193
-
194
-
195
-
196
-
197
-
198
-
199
-
200
-
201
-
202
-
203
-
204
-
205
-
206
-
207
-
208
-
209
-
210
-
211
-
212
-
213
-
214
-
215
-
216
-
217
-
218
-
219
-
220
-
221
-
222
-
223
-
224
-
225
-
226
-
227
-
228
-
229
-
230
-
231
-
232
-
233
-
234
-
235
-
236
-
237
-
238
-
239
-
240
-
241
-
242
-
243
-
244
-
245
-
246
-
247
-
248
-
249
-
250
-
251
-
252
-
253
-
254
-
255
-
256
-
257
-
258
-
 259
259 -
 260
260 -
 261
261 -
 262
262 -
 263
263 -
 264
264 -
 265
265 -
 266
266 -
 267
267 -
 268
268 -
 269
269 -
 270
270 -
 271
271 -
 272
272 -
 273
273 -
 274
274 -
 275
275 -
 276
276 -
 277
277 -
 278
278 -
 279
279 -
280
-
281
-
282
-
283
-
284
-
285
-
286
-
287
-
288
-
289
-
290
-
291
-
292
-
293
-
294
-
295
-
296
-
297
-
298
-
299
-
300
-
301
-
302
-
303
-
304
-
305
-
306
-
307
-
308
-
309
-
310
-
311
-
312
 |
 |

267
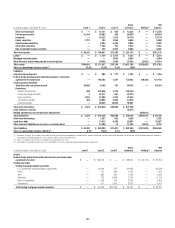
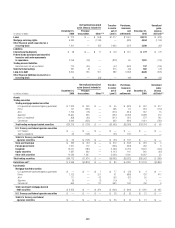
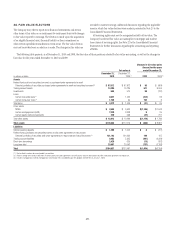
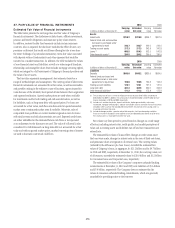
Changes in Level 3 Fair Value Category
The following tables present the changes in the Level 3 fair value category
for the years ended December 31, 2010 and 2009. The Company classifies
financial instruments in Level 3 of the fair value hierarchy when there is
reliance on at least one significant unobservable input to the valuation
model. In addition to these unobservable inputs, the valuation models for
Level 3 financial instruments typically also rely on a number of inputs that
are readily observable either directly or indirectly. Thus, the gains and losses
presented below include changes in the fair value related to both observable
and unobservable inputs.
The Company often hedges positions with offsetting positions that are
classified in a different level. For example, the gains and losses for assets
and liabilities in the Level 3 category presented in the tables below do not
reflect the effect of offsetting losses and gains on hedging instruments that
have been classified by the Company in the Level 1 and Level 2 categories. In
addition, the Company hedges items classified in the Level 3 category with
instruments also classified in Level 3 of the fair value hierarchy. The effects of
these hedges are presented gross in the following tables.
Net realized/unrealized
gains (losses) included in Transfers
in and/or
out of
Level 3
Purchases,
issuances
and
settlements
December 31,
2010
Unrealized
gains
(losses)
still held (3)
In millions of dollars
December 31,
2009
Principal
transactions Other (1)(2)
Assets
Fed funds sold and securities borrowed or
purchased under agreements to resell $ — $ 100 $ — $ 4,071 $ 740 $ 4,911 $ 374
Trading securities
Trading mortgage-backed securities
U.S. government-sponsored agency guaranteed 972 (108) — 170 (203) 831 (48)
Prime 384 77 — 255 (122) 594 27
Alt-A 387 54 — 259 (315) 385 (51)
Subprime 8,998 321 — (699) (7,495) 1,125 94
Non-U.S. residential 572 47 — 528 (923) 224 39
Commercial 2,451 64 — (308) (1,789) 418 55
Total trading mortgage-backed securities $13,764 $ 455 $ — $ 205 $(10,847) $ 3,577 $ 116
U.S. Treasury and federal agencies securities
U.S. Treasury $ — $ — $ — $ — $ — $ — $ —
Agency obligations — (3) — 63 12 72 (24)
Total U.S. Treasury and federal
agencies securities $ — $ (3) $ — $ 63 $ 12 $ 72 $ (24)
State and municipal $ 222 $ 53 $ — $ 297 $ (364) $ 208 $ 7
Foreign government 459 20 — (68) 155 566 (10)
Corporate 8,620 225 — (757) (2,082) 6,006 266
Equity securities 640 77 — 312 (253) 776 416
Asset-backed securities 3,006 4 — 4,927 (1,319) 6,618 34
Other debt securities 13,231 48 — 90 (12,064) 1,305 8
Total trading securities $39,942 $ 879 — $ 5,069 $(26,762) $19,128 $ 813
Derivatives, net (4)
Interest rate contracts $ (374) $ 513 $ — $ 467 $ (1,336) $ (730) $ 20
Foreign exchange contracts (38) 203 — (43) 42 164 (314)
Equity contracts (1,110) (498) — (331) 300 (1,639) (589)
Commodity and other contracts (529) (299) — (95) (100) (1,023) (486)
Credit derivatives 5,159 (1,405) — (635) (1,274) 1,845 (867)
Total derivatives, net (4) $ 3,108 $(1,486) — $ (637) $ (2,368) $ (1,383) $(2,236)
Investments
Mortgage-backed securities
U.S. government-sponsored agency guaranteed $ 2 $ — $ (1) $ 21 $ — $ 22 $ —
Prime 736 — (35) (493) (42) 166 —
Alt-A 55 — 12 24 (90) 1—
Subprime 1 — (2) 1 — ——
Commercial 746 — (443) 3 221 527 —
Total investment mortgage-backed
debt securities $ 1,540 $ — $ (469) $ (444) $ 89 $ 716 $ —
U.S. Treasury and federal agencies securities $ 21 $ — $ (21) $ — $ 17 $ 17 $ (1)
State and municipal 217 — — 481 (194) 504 (75)
Foreign government 270 — 9 15 64 358 1
Corporate 1,257 — (39) (49) (151) 1,018 (32)
Equity securities 2,513 — 65 (1) (522) 2,055 (77)
Asset-backed securities 8,272 — (123) (111) (2,614) 5,424 (15)
Other debt securities 560 — (13) (13) 193 727 25
Non-marketable equity securities 6,753 — 733 18 (1,037) 6,467 512
Total investments $21,403 $ — $ 142 $ (104) $ (4,155) $17,286 $ 338