Citibank 2010 Annual Report Download - page 94
Download and view the complete annual report
Please find page 94 of the 2010 Citibank annual report below. You can navigate through the pages in the report by either clicking on the pages listed below, or by using the keyword search tool below to find specific information within the annual report.-
 1
1 -
2
-
3
-
4
-
5
-
6
-
7
-
8
-
9
-
10
-
11
-
12
-
13
-
14
-
15
-
16
-
17
-
18
-
19
-
20
-
21
-
22
-
23
-
24
-
25
-
26
-
27
-
28
-
29
-
30
-
31
-
32
-
33
-
34
-
35
-
36
-
37
-
38
-
39
-
40
-
41
-
42
-
43
-
44
-
45
-
46
-
47
-
48
-
49
-
50
-
51
-
52
-
53
-
54
-
55
-
56
-
57
-
58
-
59
-
60
-
61
-
62
-
63
-
64
-
65
-
66
-
67
-
68
-
69
-
70
-
71
-
72
-
73
-
74
-
75
-
76
-
77
-
78
-
79
-
80
-
81
-
82
-
83
-
 84
84 -
 85
85 -
 86
86 -
 87
87 -
 88
88 -
 89
89 -
 90
90 -
 91
91 -
 92
92 -
 93
93 -
 94
94 -
 95
95 -
 96
96 -
 97
97 -
 98
98 -
 99
99 -
 100
100 -
 101
101 -
 102
102 -
 103
103 -
 104
104 -
105
-
106
-
107
-
108
-
109
-
110
-
111
-
112
-
113
-
114
-
115
-
116
-
117
-
118
-
119
-
120
-
121
-
122
-
123
-
124
-
125
-
126
-
127
-
128
-
129
-
130
-
131
-
132
-
133
-
134
-
135
-
136
-
137
-
138
-
139
-
140
-
141
-
142
-
143
-
144
-
145
-
146
-
147
-
148
-
149
-
150
-
151
-
152
-
153
-
154
-
155
-
156
-
157
-
158
-
159
-
160
-
161
-
162
-
163
-
164
-
165
-
166
-
167
-
168
-
169
-
170
-
171
-
172
-
173
-
174
-
175
-
176
-
177
-
178
-
179
-
180
-
181
-
182
-
183
-
184
-
185
-
186
-
187
-
188
-
189
-
190
-
191
-
192
-
193
-
194
-
195
-
196
-
197
-
198
-
199
-
200
-
201
-
202
-
203
-
204
-
205
-
206
-
207
-
208
-
209
-
210
-
211
-
212
-
213
-
214
-
215
-
216
-
217
-
218
-
219
-
220
-
221
-
222
-
223
-
224
-
225
-
226
-
227
-
228
-
229
-
230
-
231
-
232
-
233
-
234
-
235
-
236
-
237
-
238
-
239
-
240
-
241
-
242
-
243
-
244
-
245
-
246
-
247
-
248
-
249
-
250
-
251
-
252
-
253
-
254
-
255
-
256
-
257
-
258
-
259
-
260
-
261
-
262
-
263
-
264
-
265
-
266
-
267
-
268
-
269
-
270
-
271
-
272
-
273
-
274
-
275
-
276
-
277
-
278
-
279
-
280
-
281
-
282
-
283
-
284
-
285
-
286
-
287
-
288
-
289
-
290
-
291
-
292
-
293
-
294
-
295
-
296
-
297
-
298
-
299
-
300
-
301
-
302
-
303
-
304
-
305
-
306
-
307
-
308
-
309
-
310
-
311
-
312
 |
 |

92
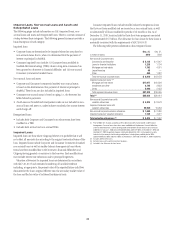
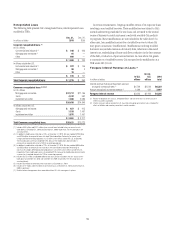
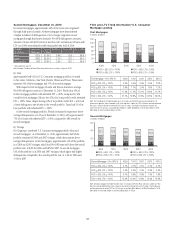
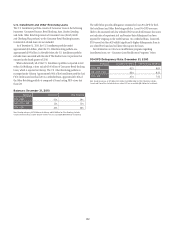
Loan Maturities and Fixed/Variable Pricing Corporate
Loans
In millions of dollars at year end
Due
within
1 year
Over 1 year
but within
5 years
Over 5
years Total
Corporate loan portfolio
maturities
In U.S. offices
Commercial and
industrial loans $ 9,559 $ 2,507 $ 2,268 $ 14,334
Financial institutions 19,881 5,215 4,717 29,813
Mortgage and real estate 13,133 3,445 3,115 19,693
Lease financing 943 247 223 1,413
Installment, revolving
credit, other 8,429 2,211 2,000 12,640
In offices outside the U.S. 69,874 32,910 11,457 114,241
Total Corporate loans $121,819 $46,535 $23,780 $192,134
Fixed/variable pricing of
corporate loans with
maturities due after one
year (1)
Loans at fixed interest rates $ 9,730 $ 9,436
Loans at floating or adjustable
interest rates 36,805 14,344
Total $46,535 $23,780
(1) Based on contractual terms. Repricing characteristics may effectively be modified from time to time
using derivative contracts. See Note 23 to the Consolidated Financial Statements.
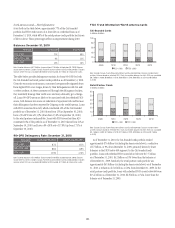
U.S. Consumer Mortgage Lending
Overview
Citi’s North America Consumer mortgage portfolio consists of both first
and second mortgages. As set forth in the table below, as of December 31,
2010, the first mortgage portfolio totaled approximately $102 billion while
the second mortgage portfolio was approximately $49 billion. Although the
majority of the mortgage portfolio is reported in LCL within Citi Holdings,
there are $20 billion of first mortgages and $4 billion of second mortgages
reported in Citicorp.
U.S. Consumer Mortgage and Real Estate Loans
In millions of dollars at year end 2010
Due
within
1 year
Over 1 year
but within
5 years
Over 5
years Total
U.S. Consumer mortgage
loan portfolio type
First mortgages $17,601 $18,802 $ 66,086 $102,489
Second mortgages 478 9,107 39,395 48,980
Total $18,079 $27,909 $105,481 $151,469
Fixed/variable pricing of
U.S. Consumer
mortgage loans with
maturities due after one year
Loans at fixed interest rates $ 2,662 $ 80,327
Loans at floating or adjustable
interest rates 25,247 25,154
Total $27,909 $105,481