Citibank 2010 Annual Report Download - page 232
Download and view the complete annual report
Please find page 232 of the 2010 Citibank annual report below. You can navigate through the pages in the report by either clicking on the pages listed below, or by using the keyword search tool below to find specific information within the annual report.-
 1
1 -
2
-
3
-
4
-
5
-
6
-
7
-
8
-
9
-
10
-
11
-
12
-
13
-
14
-
15
-
16
-
17
-
18
-
19
-
20
-
21
-
22
-
23
-
24
-
25
-
26
-
27
-
28
-
29
-
30
-
31
-
32
-
33
-
34
-
35
-
36
-
37
-
38
-
39
-
40
-
41
-
42
-
43
-
44
-
45
-
46
-
47
-
48
-
49
-
50
-
51
-
52
-
53
-
54
-
55
-
56
-
57
-
58
-
59
-
60
-
61
-
62
-
63
-
64
-
65
-
66
-
67
-
68
-
69
-
70
-
71
-
72
-
73
-
74
-
75
-
76
-
77
-
78
-
79
-
80
-
81
-
82
-
83
-
84
-
85
-
86
-
87
-
88
-
89
-
90
-
91
-
92
-
93
-
94
-
95
-
96
-
97
-
98
-
99
-
100
-
101
-
102
-
103
-
104
-
105
-
106
-
107
-
108
-
109
-
110
-
111
-
112
-
113
-
114
-
115
-
116
-
117
-
118
-
119
-
120
-
121
-
122
-
123
-
124
-
125
-
126
-
127
-
128
-
129
-
130
-
131
-
132
-
133
-
134
-
135
-
136
-
137
-
138
-
139
-
140
-
141
-
142
-
143
-
144
-
145
-
146
-
147
-
148
-
149
-
150
-
151
-
152
-
153
-
154
-
155
-
156
-
157
-
158
-
159
-
160
-
161
-
162
-
163
-
164
-
165
-
166
-
167
-
168
-
169
-
170
-
171
-
172
-
173
-
174
-
175
-
176
-
177
-
178
-
179
-
180
-
181
-
182
-
183
-
184
-
185
-
186
-
187
-
188
-
189
-
190
-
191
-
192
-
193
-
194
-
195
-
196
-
197
-
198
-
199
-
200
-
201
-
202
-
203
-
204
-
205
-
206
-
207
-
208
-
209
-
210
-
211
-
212
-
213
-
214
-
215
-
216
-
217
-
218
-
219
-
220
-
221
-
 222
222 -
 223
223 -
 224
224 -
 225
225 -
 226
226 -
 227
227 -
 228
228 -
 229
229 -
 230
230 -
 231
231 -
 232
232 -
 233
233 -
 234
234 -
 235
235 -
 236
236 -
 237
237 -
 238
238 -
 239
239 -
 240
240 -
 241
241 -
 242
242 -
243
-
244
-
245
-
246
-
247
-
248
-
249
-
250
-
251
-
252
-
253
-
254
-
255
-
256
-
257
-
258
-
259
-
260
-
261
-
262
-
263
-
264
-
265
-
266
-
267
-
268
-
269
-
270
-
271
-
272
-
273
-
274
-
275
-
276
-
277
-
278
-
279
-
280
-
281
-
282
-
283
-
284
-
285
-
286
-
287
-
288
-
289
-
290
-
291
-
292
-
293
-
294
-
295
-
296
-
297
-
298
-
299
-
300
-
301
-
302
-
303
-
304
-
305
-
306
-
307
-
308
-
309
-
310
-
311
-
312
 |
 |

230
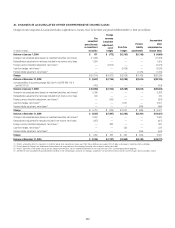
21. CHANGES IN ACCUMULATED OTHER COMPREHENSIVE INCOME (LOSS)
Changes in each component of Accumulated other comprehensive income (loss) for the three-year period ended December 31, 2010 are as follows:
In millions of dollars
Net
unrealized
gains (losses)
on investment
securities
Foreign
currency
translation
adjustment,
net of
hedges
Cash flow
hedges
Pension
liability
adjustments
Accumulated
other
comprehensive
income (loss)
Balance at January 1, 2008 $ 471 $ (772) $(3,163) $(1,196) $ (4,660)
Change in net unrealized gains (losses) on investment securities, net of taxes (11,422) — — — (11,422)
Reclassification adjustment for net losses included in net income, net of taxes 1,304 — — — 1,304
Foreign currency translation adjustment, net of taxes (1) — (6,972) — — (6,972)
Cash flow hedges, net of taxes (2) — — (2,026) — (2,026)
Pension liability adjustment, net of taxes (3) — — — (1,419) (1,419)
Change $ (10,118) $ (6,972) $ (2,026) $ (1,419) $(20,535)
Balance at December 31, 2008 $ (9,647) $(7,744) $(5,189) $(2,615) $(25,195)
Cumulative effect of accounting change (ASC 320-10-35/FSP FAS 115-2
and FAS 124-2) (413) — — — (413)
Balance at January 1, 2009 $(10,060) $(7,744) $(5,189) $(2,615) $(25,608)
Change in net unrealized gains (losses) on investment securities, net of taxes (4) 5,268 — — — 5,268
Reclassification adjustment for net losses included in net income, net of taxes 445 — — — 445
Foreign currency translation adjustment, net of taxes (1) — (203) — — (203)
Cash flow hedges, net of taxes (2) — — 2,007 — 2,007
Pension liability adjustment, net of taxes (3) — — — (846) (846)
Change $ 5,713 $ (203) $ 2,007 $ (846) $ 6,671
Balance at December 31, 2009 $ (4,347) $(7,947) $(3,182) $(3,461) $(18,937)
Change in net unrealized gains (losses) on investment securities, net of taxes (4) 2,609 — — — 2,609
Reclassification adjustment for net gains included in net income, net of taxes (657) — — — (657)
Foreign currency translation adjustment, net of taxes (1) — 820 — — 820
Cash flow hedges, net of taxes (2) — — 532 — 532
Pension liability adjustment, net of taxes (3) — — — (644) (644)
Change $ 1,952 $ 820 $ 532 $ (644) 2,660
Balance at December 31, 2010 $ (2,395) $(7,127) $(2,650) $(4,105) $(16,277)
(1) Reflects, among other items: the movements in the British pound, Euro, Japanese yen, Korean won, Polish zloty and Mexican peso against the U.S. dollar, and changes in related tax effects and hedges.
(2) Primarily driven by Citigroup’s pay fixed/receive floating interest rate swap programs that are hedging the floating rates on deposits and long-term debt.
(3) Reflects adjustments to the funded status of pension and postretirement plans, which is the difference between the fair value of the plan assets and the projected benefit obligation.
(4) See Note 15 to the Consolidated Financial Statements for details of the unrealized gains and losses on Citigroup’s available-for-sale and held-to-maturity securities and the net gains (losses) included in income.