Citibank 2010 Annual Report Download - page 47
Download and view the complete annual report
Please find page 47 of the 2010 Citibank annual report below. You can navigate through the pages in the report by either clicking on the pages listed below, or by using the keyword search tool below to find specific information within the annual report.-
 1
1 -
2
-
3
-
4
-
5
-
6
-
7
-
8
-
9
-
10
-
11
-
12
-
13
-
14
-
15
-
16
-
17
-
18
-
19
-
20
-
21
-
22
-
23
-
24
-
25
-
26
-
27
-
28
-
29
-
30
-
31
-
32
-
33
-
34
-
35
-
36
-
 37
37 -
 38
38 -
 39
39 -
 40
40 -
 41
41 -
 42
42 -
 43
43 -
 44
44 -
 45
45 -
 46
46 -
 47
47 -
 48
48 -
 49
49 -
 50
50 -
 51
51 -
 52
52 -
 53
53 -
 54
54 -
 55
55 -
 56
56 -
 57
57 -
58
-
59
-
60
-
61
-
62
-
63
-
64
-
65
-
66
-
67
-
68
-
69
-
70
-
71
-
72
-
73
-
74
-
75
-
76
-
77
-
78
-
79
-
80
-
81
-
82
-
83
-
84
-
85
-
86
-
87
-
88
-
89
-
90
-
91
-
92
-
93
-
94
-
95
-
96
-
97
-
98
-
99
-
100
-
101
-
102
-
103
-
104
-
105
-
106
-
107
-
108
-
109
-
110
-
111
-
112
-
113
-
114
-
115
-
116
-
117
-
118
-
119
-
120
-
121
-
122
-
123
-
124
-
125
-
126
-
127
-
128
-
129
-
130
-
131
-
132
-
133
-
134
-
135
-
136
-
137
-
138
-
139
-
140
-
141
-
142
-
143
-
144
-
145
-
146
-
147
-
148
-
149
-
150
-
151
-
152
-
153
-
154
-
155
-
156
-
157
-
158
-
159
-
160
-
161
-
162
-
163
-
164
-
165
-
166
-
167
-
168
-
169
-
170
-
171
-
172
-
173
-
174
-
175
-
176
-
177
-
178
-
179
-
180
-
181
-
182
-
183
-
184
-
185
-
186
-
187
-
188
-
189
-
190
-
191
-
192
-
193
-
194
-
195
-
196
-
197
-
198
-
199
-
200
-
201
-
202
-
203
-
204
-
205
-
206
-
207
-
208
-
209
-
210
-
211
-
212
-
213
-
214
-
215
-
216
-
217
-
218
-
219
-
220
-
221
-
222
-
223
-
224
-
225
-
226
-
227
-
228
-
229
-
230
-
231
-
232
-
233
-
234
-
235
-
236
-
237
-
238
-
239
-
240
-
241
-
242
-
243
-
244
-
245
-
246
-
247
-
248
-
249
-
250
-
251
-
252
-
253
-
254
-
255
-
256
-
257
-
258
-
259
-
260
-
261
-
262
-
263
-
264
-
265
-
266
-
267
-
268
-
269
-
270
-
271
-
272
-
273
-
274
-
275
-
276
-
277
-
278
-
279
-
280
-
281
-
282
-
283
-
284
-
285
-
286
-
287
-
288
-
289
-
290
-
291
-
292
-
293
-
294
-
295
-
296
-
297
-
298
-
299
-
300
-
301
-
302
-
303
-
304
-
305
-
306
-
307
-
308
-
309
-
310
-
311
-
312
 |
 |

45
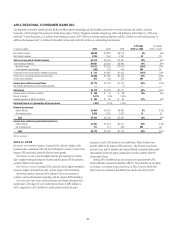
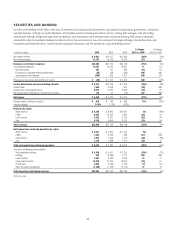
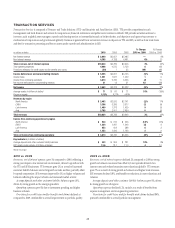
TRANSACTION SERVICES
Transaction Services is composed of Treasury and Trade Solutions (TTS) and Securities and Fund Services (SFS). TTS provides comprehensive cash
management and trade finance and services for corporations, financial institutions and public sector entities worldwide. SFS provides securities services to
investors, such as global asset managers, custody and clearing services to intermediaries such as broker-dealers, and depository and agency/trust services to
multinational corporations and governments globally. Revenue is generated from net interest revenue on deposits in TTS and SFS, as well as from trade loans
and fees for transaction processing and fees on assets under custody and administration in SFS.
In millions of dollars 2010 2009 2008
% Change
2010 vs. 2009
% Change
2009 vs. 2008
Net interest revenue $ 5,649 $5,651 $5,485 —3%
Non-interest revenue 4,385 4,138 4,461 6% (7)
Total revenues, net of interest expense $10,034 $9,789 $9,946 3% (2)%
Total operating expenses 4,868 4,515 5,156 8(12)
Provisions (releases) for credit losses and for benefits and claims (59) 7 35 NM (80)
Income before taxes and noncontrolling interests $ 5,225 $5,267 $4,755 (1)% 11%
Income taxes 1,551 1,531 1,402 19
Income from continuing operations 3,674 3,736 3,353 (2) 11
Net income attributable to noncontrolling interests 21 13 31 62 (58)
Net income $ 3,653 $3,723 $3,322 (2)% 12%
Average assets (in billions of dollars) $ 71 $ 60 $ 71 18% (15)%
Return on assets 5.15% 6.21% 4.69%
Revenues by region
North America $ 2,483 $2,526 $2,161 (2)% 17%
EMEA 3,356 3,389 3,677 (1) (8)
Latin America 1,490 1,373 1,439 9(5)
Asia 2,705 2,501 2,669 8(6)
Total revenues $10,034 $9,789 $9,946 3% (2)%
Income from continuing operations by region
North America $ 544 $ 615 $ 323 (12)% 90%
EMEA 1,224 1,287 1,246 (5) 3
Latin America 653 604 588 83
Asia 1,253 1,230 1,196 23
Total net income from continuing operations $ 3,674 $3,736 $3,353 (2)% 11%
Key indicators (in billions of dollars)
Average deposits and other customer liability balances $ 333 $ 304 $ 281 10% 8%
EOP assets under custody (in trillions of dollars) 12.6 12.1 11.0 410
NM Not meaningful
2010 vs. 2009
Revenues, net of interest expense, grew 3% compared to 2009, reflecting a
strong year despite a low interest rate environment, driven by growth in both
the TTS and SFS businesses. TTS revenues grew 2% as a result of increased
customer liability balances and solid growth in trade and fees, partially offset
by spread compression. SFS revenues improved by 3% on higher volumes and
balances reflecting the impact of sales and increased market activity.
Average deposits and other customer liability balances grew 10%,
driven by strong growth in the emerging markets.
Operating expenses grew 8% due to investment spending and higher
business volumes.
Provisions for credit losses and for benefits and claims declined as
compared to 2009, attributable to overall improvement in portfolio quality.
2009 vs. 2008
Revenues, net of interest expense declined 2% compared to 2008 as strong
growth in balances was more than offset by lower spreads driven by low
interest rates and reduced securities asset valuations globally. TTS revenues
grew 7% as a result of strong growth in balances and higher trade revenues.
SFS revenues declined 18%, attributable to reductions in asset valuations and
volumes.
Average deposits and other customer liability balances grew 8%, driven
by strong growth in all regions.
Operating expenses declined 12%, mainly as a result of benefits from
expense management and re-engineering initiatives.
Provisions for credit losses and for benefits and claims declined 80%,
primarily attributable to overall portfolio management.